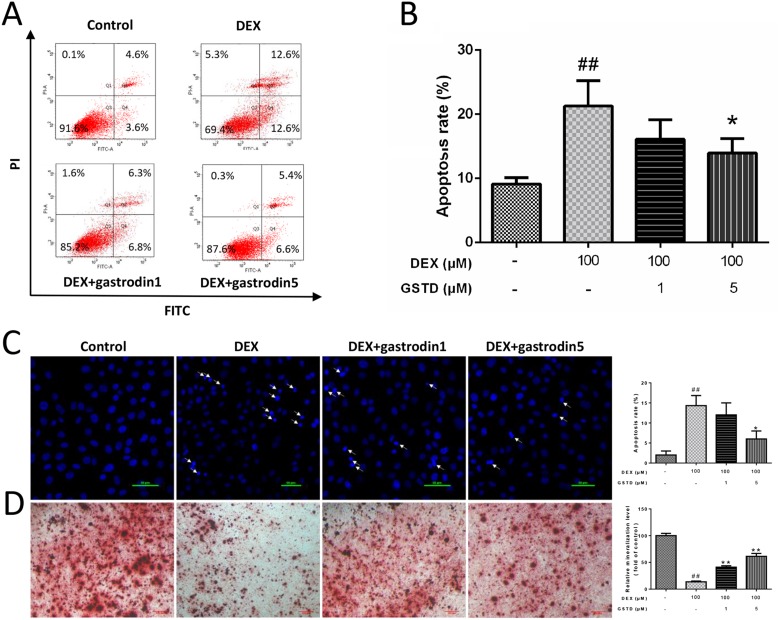
Figure 3. Effects of GSTD on DEX induced apoptosis and differentiation in primary osteoblasts (n = 3).
(A) Cells were treated with GSTD (1, 5 μM) for 2 h prior to incubation with DEX (100 μM) for 24 h. Flow cytometric analysis was used to measure apoptotic rate. (B) Levels of apoptotic rate were statistically quantitated shown in column. Data are presented as the mean ± SD. (C) Apoptotic cells (arrow) were detected by Hoechst staining. (D) GSTD antagonized DEX on promoting osteogenic differentiation and mineralization by alizarin red staining. ##P < 0.01 vs control; *P < 0.05 vs DEX.

