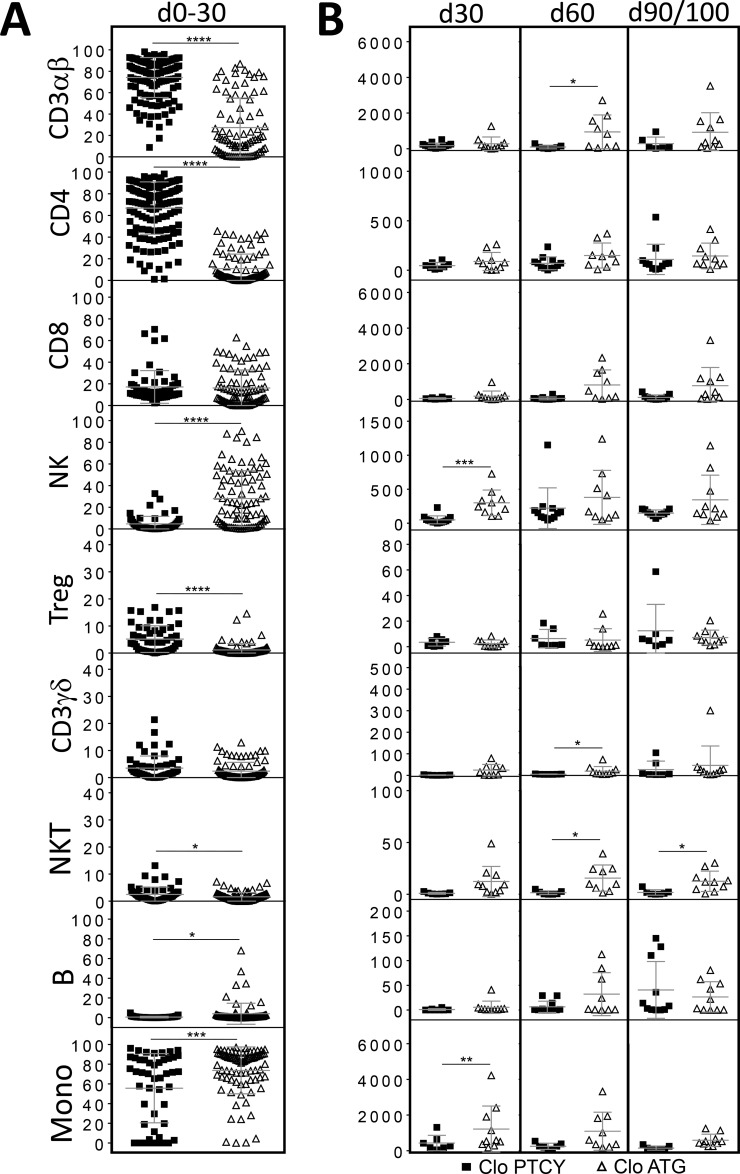
Figure 4. Comparison of numerical immune reconstitution between PTCY and ATG subgroups considering only patients receiving clofarabine-based regimens.
(A) Scatter plots representing the studied cell frequencies (CD3αβ, CD4, CD8β, NK, Treg, CD3γδ, NKT, B and monocytes) observed in peripheral blood of patients between day 0 and day 30. Results are represented as medians with interquartile ranges. (B) Scatter plots representing the absolute counts of studied cell populations in peripheral blood of patients at day 30, 60 and 90/100 since HSCT. Results are represented as medians with interquartile ranges. Statistical significance (*p < 0.05, **p < 0.01, ***p < 0.001, ****p < 0.0001) was determined between two groups using the unpaired t-test and was determined between more than two groups using the one-way ANOVA test.

