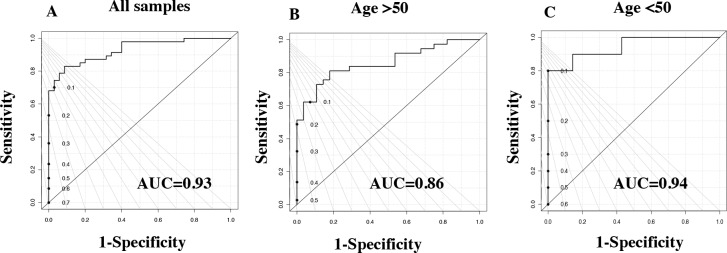
Figure 1. Tissue metabolite profiles derived from breast cancer patients are different from healthy control individuals.
ROC curve for (A) PLS-DA model (based on 27 measured metabolites) with 47 breast cancer patients and 35 healthy controls. (B) PLS-DA model (based on 27 metabolites) with postmenopausal women breast cancer tissue and adjacent control tissue with women of >50 years of age. (C) PLS-DA model (based on the 27 metabolites) with premenopausal women breast cancer tissue and adjacent control tissue with women of <50 years of age.

