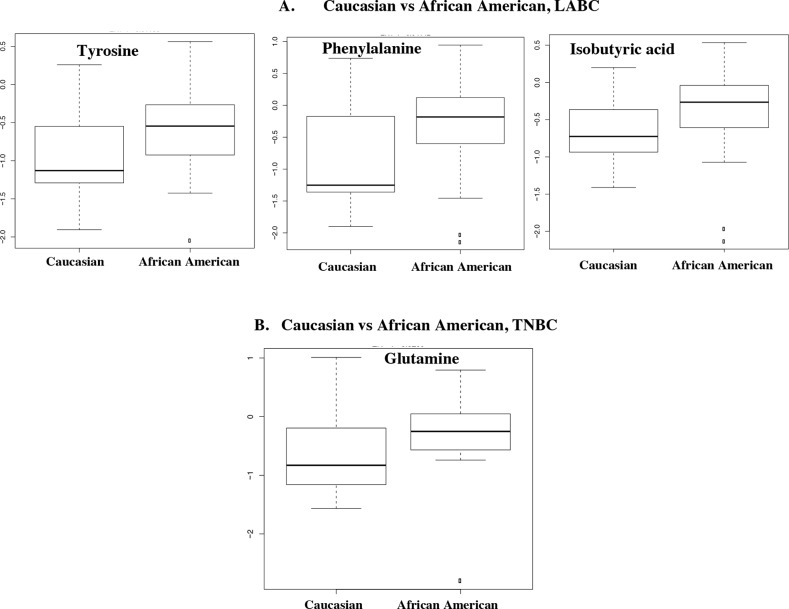
Figure 4.
Box-and-whisker plots of metabolites with p-values < 0.05 illustrating discrimination between tumor tissues from African American and Caucasian (A) LABC and (B) TNBC. A horizontal line in the middle portion of the box represents the mean. Top and bottom boundaries of boxes show the 75th and 25th percentiles, respectively. Upper and lower whiskers show 95th and 5th percentiles, respectively. Open circles show outliers.

