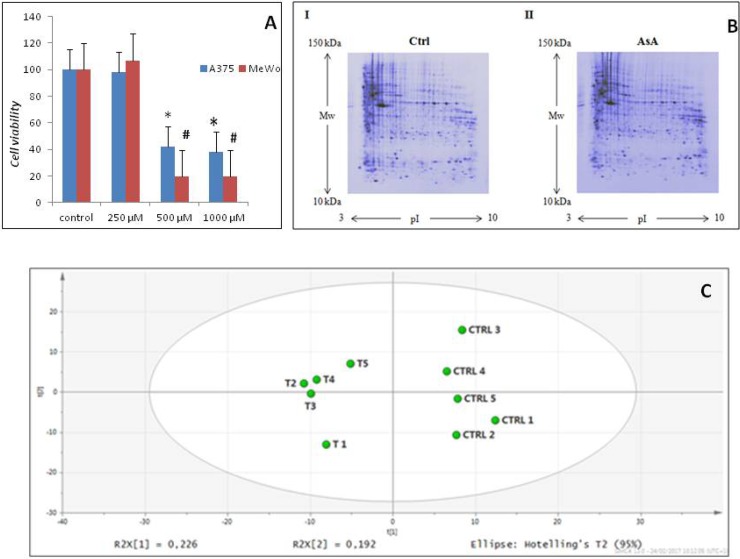
Figure 1. AsA treatment effects in melanoma cells.
(A) After treating A375 and Mewo cells with AsA at 500 and 1000 μM concentrations, a statistically significant dose-dependent reduction of cell viability was observed for both cell lines (*p < 0.05; #p < 0.01). (B) Representative two-dimensional gel electrophoresis images obtained using a) control and b) AsA treated MeWo cells. (C) Principal component analysis of proteome patterns. The two principal components PC1 and PC2 were 22,6% and 19,2%, respectively. The PCA scatterplot clearly clustered the individual proteome maps into two distinct groups corresponding to the two experimental groups considered (controls and AsA treated cells).

