. 2018 Feb 9;7:e33101. doi: 10.7554/eLife.33101

Figure 1. Both human mTOR complexes resolved at intermediate resolution.

(A–C) The architecture of human mTORC2. The structure is shown rotated as indicated by the arrows between the panels. The accessory factor density from focused refinement is shown within the dimeric, C2-symmetric mTORC2 density in pink. (D–E) The architecture of human mTORC1 (Aylett et al., 2016). The structure is shown rotated as indicated by the arrows between the panels. All complexes are shown with cryo-EM density as a grey transparent surface and the fitted structures in cartoon representation, coloured according to the primary structure schematics shown between the corresponding panels.

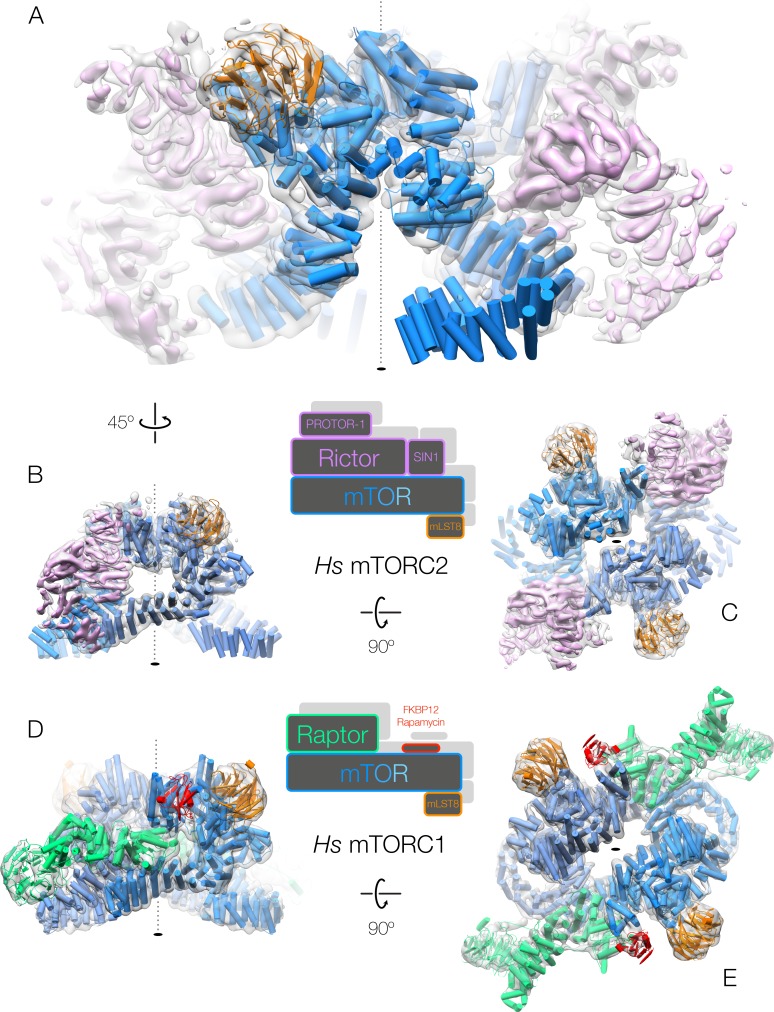
Figure 1.

Figure 1—figure supplement 1. Purification and characterisation of mTORC2.

Figure 1—figure supplement 1.

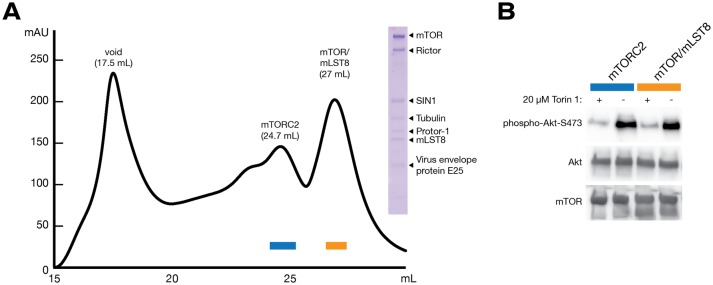
(A) Size exclusion chromatography elution profile of mTORC2 from a tandem Superose 6 Increase 10/300 GL column. Peaks representing the void, mTORC2 and excess mTOR-mLST8 are labeled. SDS-PAGE analysis of the final mTORC2 sample is shown in inset. Tubulin and virus envelope protein E25 were detected by mass spectrometry as contaminants. Fractions used for the in vitro kinase activity assay are indicated with a blue and orange box. (B) In vitro kinase activity assay of recombinant mTORC2. Western blots showing the phosphorylation state of Akt-1 in the presence and absence of mTOR inhibitor Torin1.

Figure 1—figure supplement 2. Analysis of negatively stained mTORC2 without applying chemical fixation.

Figure 1—figure supplement 2.

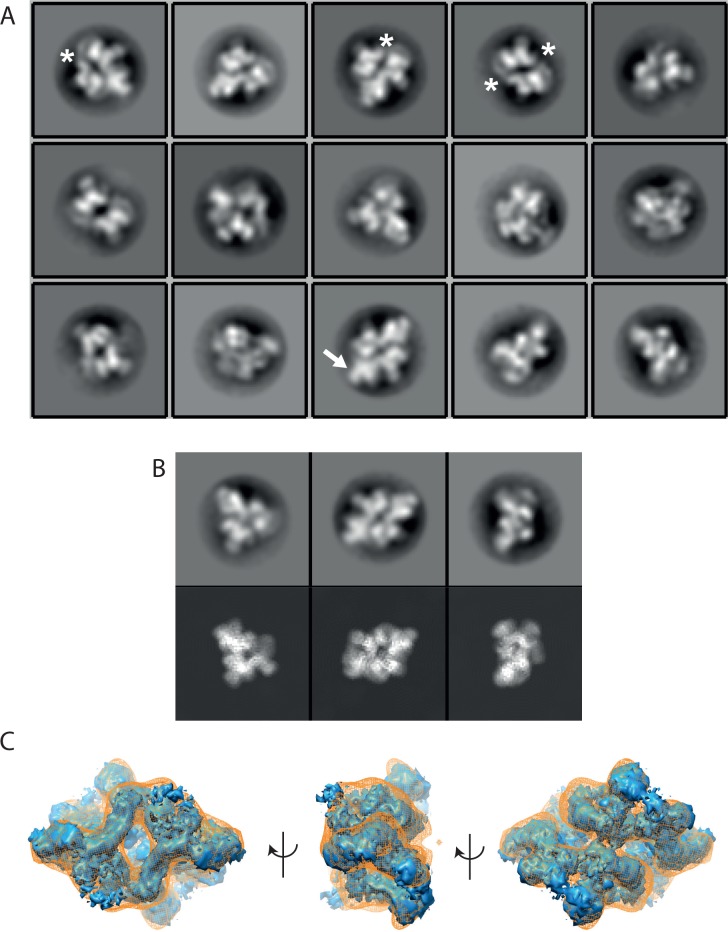
(A) Most populated class averages (out of 80 class averages) of a 2D classification of negatively stained non-cross-linked mTORC2. In some class averages a peripheral density (arrow) is underrepresented (star). (B) Comparison of representative class averages (upper panel) with reprojections of the cryo-EM reconstruction with matching projection angles (lower panel). (C) Reconstruction of the non-cross-linked mTORC2 (orange mesh) from negatively stained grids superimposed on a down sampled cryo-EM density of the cross-linked mTORC2.

Figure 1—figure supplement 3. Sample micrograph and resolution statistics for mTORC2.

Figure 1—figure supplement 3.

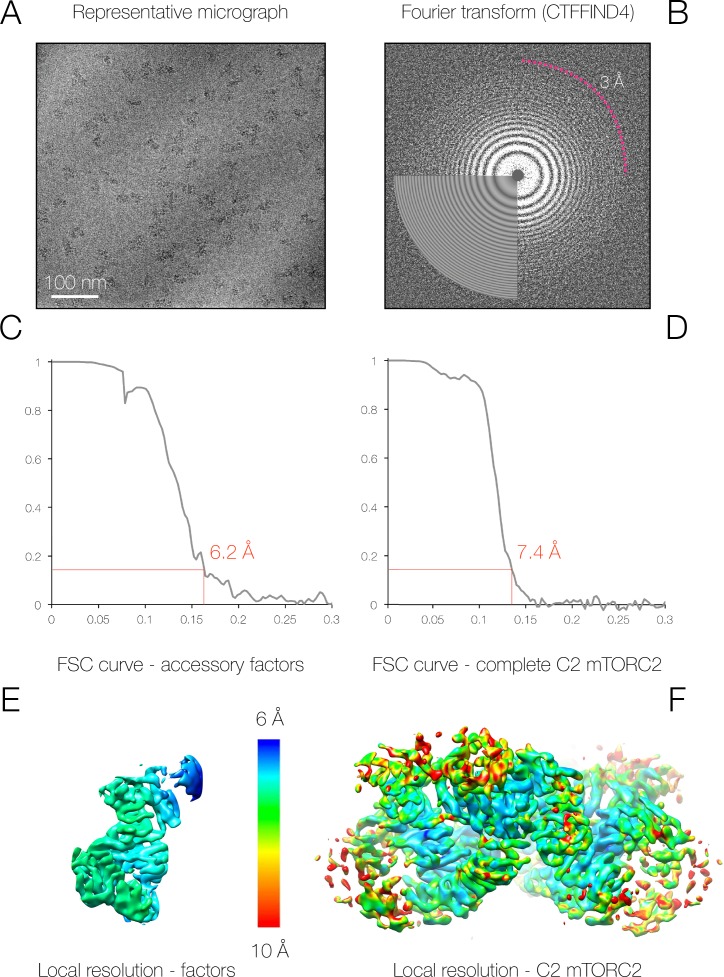
(A–B) Sample micrograph and its power spectrum. Thon rings visible to 3 Å are indicated. (C–D) Fourier shell correlation plots for the full mTORC2 dimeric complex and the mTORC2 accessory protein region, calculated between independently refined half sets (gold-standard) (Scheres, 2012). (E–F) The surface of each mTORC2 density is shown coloured according to local resolution (6 Å in blue through to 10 Å in red) (Kucukelbir et al., 2014).

Figure 1—figure supplement 4. Cryo-EM classification schematic.

Figure 1—figure supplement 4.

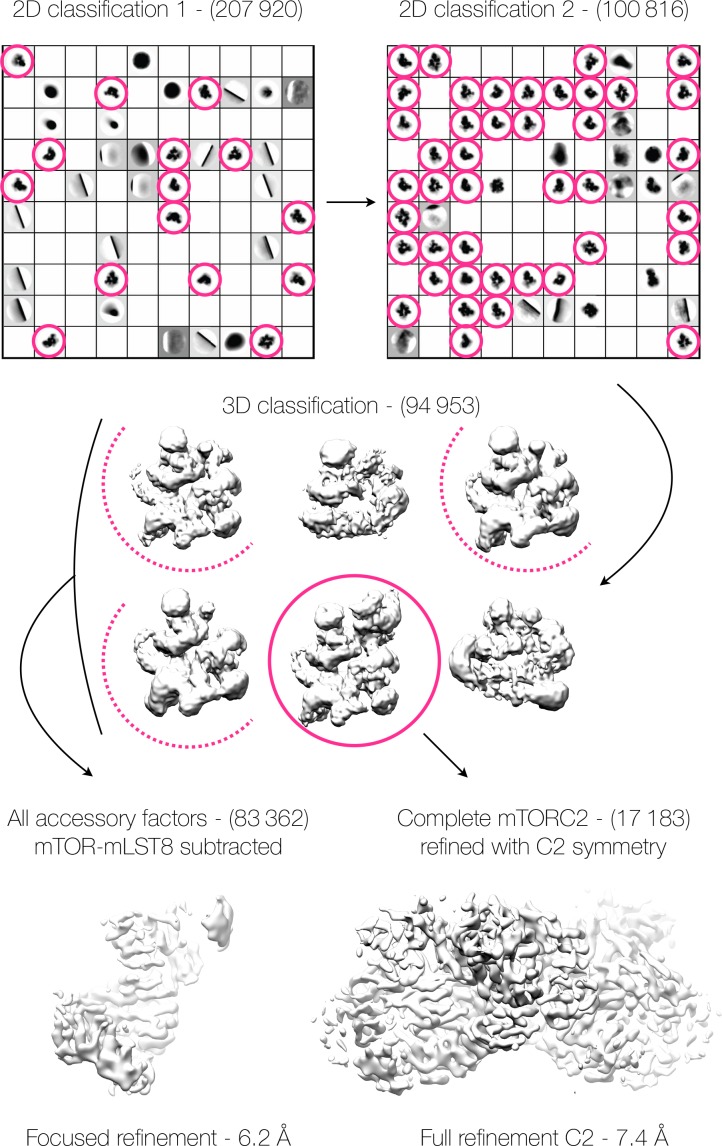
The reconstructions from each round of classification, the number of particles involved in each step, and the retention of particles between stages of the classification are shown as a flow diagram. Magenta circles indicate the classes from which particles were retained at each stage, dotted half-circles indicate single-sided particles retained after subtraction of the opposing density.

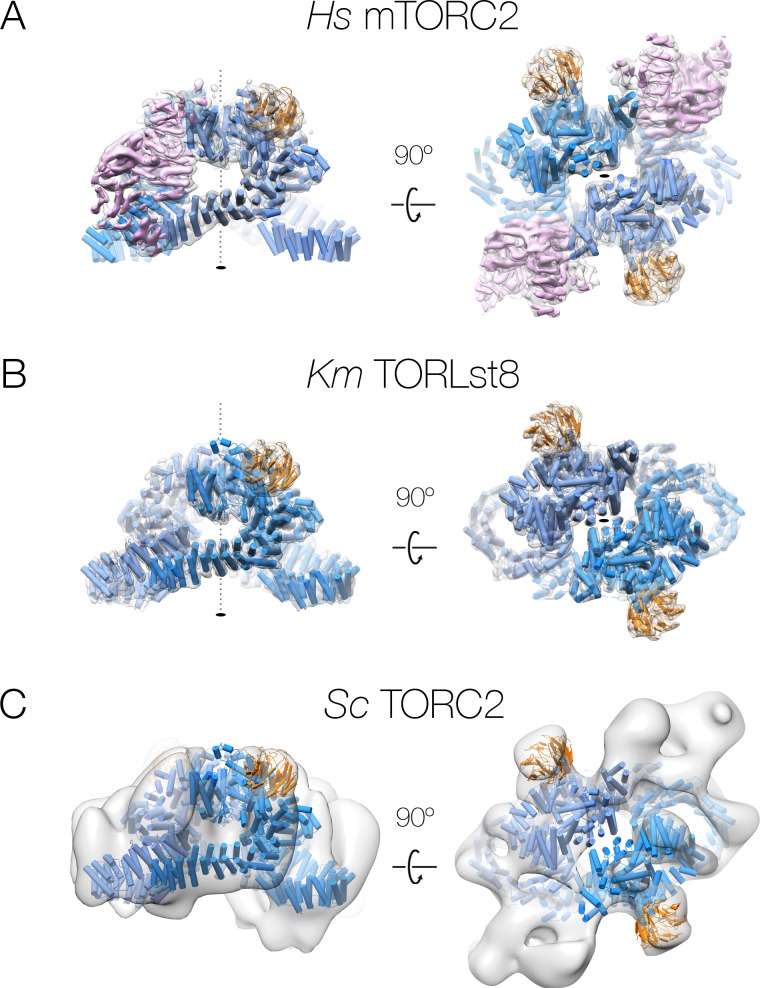
Figure 1—figure supplement 5. Comparison of human and yeast TOR complexes:.

Figure 1—figure supplement 5.

(A) human mTORC2, (B) K.m. TOR-Lst8, (C) S.c. TORC2. Each structure is shown rotated as indicated by the arrows. The accessory factor density from focused refinement is shown within the C2-symmetric mTORC2 density. All complexes are shown with the corresponding cryo-EM density as a grey transparent surface, the fitted structures in cartoon representation, and are coloured according to the colour scheme from Figure 1.