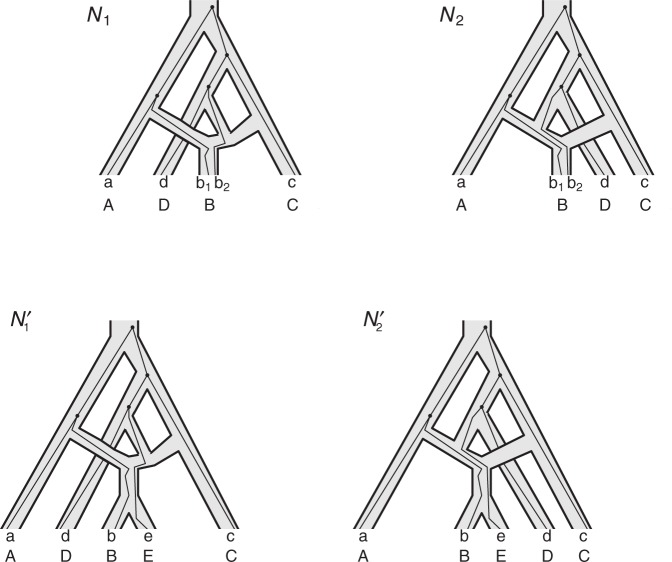
Figure 5.
Gene trees in networks that display the same trees. Here  and
and  display the same trees with the same branch lengths given suitable choices of parameters. Similarly,
  and
and  display the same trees. Two gene trees are shown with coalescence times that are compatible with both
  and
and  , and another two gene trees are shown with coalescence times compatible with both
  and
and  so that knowing the coalescence times in the gene tree does not determine which network it evolved in. The gene trees in this figure cannot be represented as having evolved in a species tree displayed by the networks. The gene tree in
  corresponds to case
  where
where  goes left,
  goes right, then left. The gene tree in
  corresponds to case
  , where both go left, then
  goes left,
  goes right.

