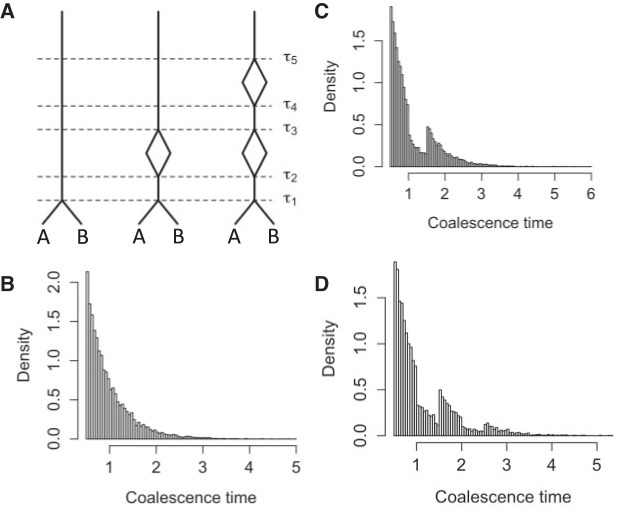
Figure 8.
Coalescence times for networks with multi-edges. a) The leftmost species history is a two-taxon species tree. The middle and right species histories have one or two sets of multi-edges, reflecting species diverging and subsequently hybridizing without any other speciation. Histograms of 100,000 coalescence times for single genes sampled from species  and
and  are depicted in (b)–(d). (c) and (d) correspond to the middle and rightmost species histories, respectively. Simulations are based on
  coalescent units and were done in the program ms (Hudson 2002).

