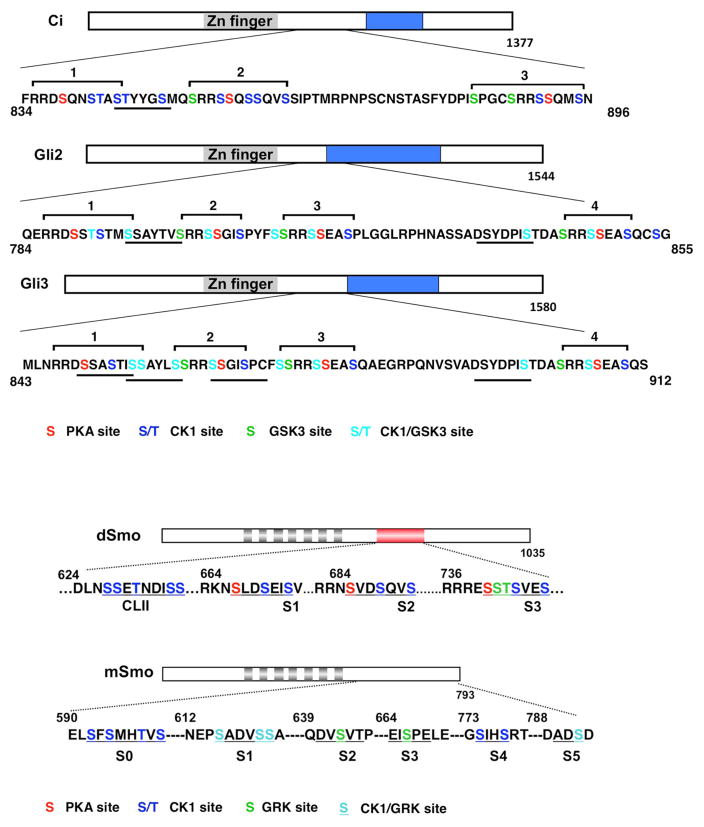
Fig. 3. CK1 phosphorylates both Ci/Gli and Smo in the Hh pathway.
(Top) Diagrams of Ci, mouse Gli2, and human Gli3 showing the PKA/GSK3/CK1 phosphorylation clusters in Ci/Gli. Putative Slimb/β-TRCP binding sites in Ci/Gli are underlined. Grey and blue boxes denote a Zn-finger DNA binding domain and a trans-activation domain, respectively. Phosphorylation sites for the indicated kinases are color-coded. (Bottom) Diagrams showing the Smo phosphorylation sites in Drosophila (top) and mammalian Smo (bottom). Grey boxes indicate transmembrane helixes. The red box in Drosophila Smo C-tail denotes the SAID domain. The phosphorylation clusters are underlined and phosphorylation sites for the indicated kinases are color-coded.

