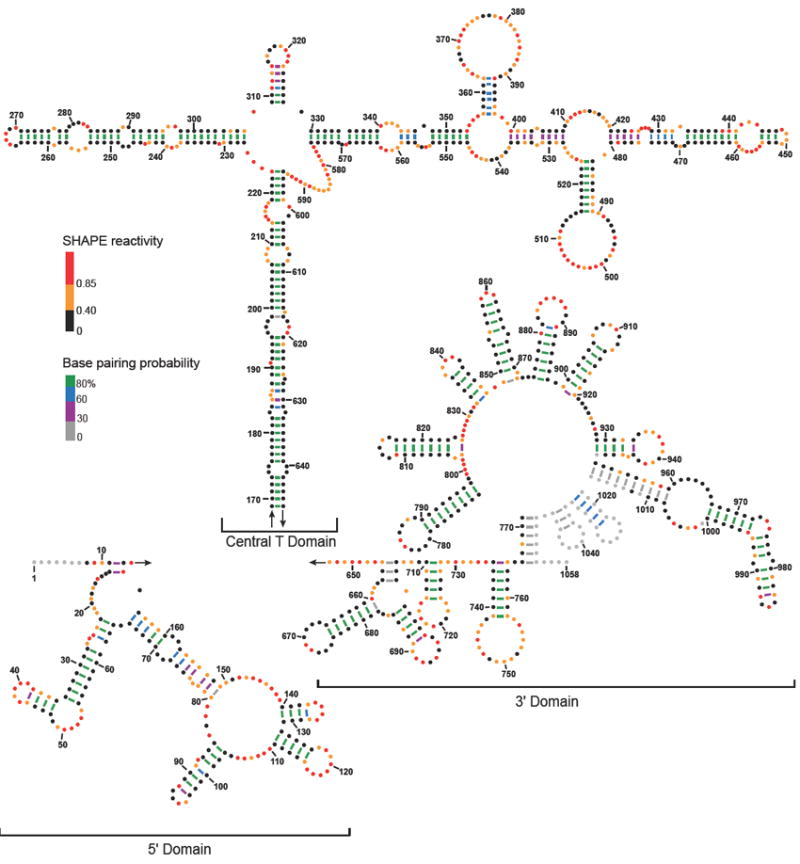
Figure 4.

Secondary structure model for the in virio STMV RNA genome. Nucleotides are colored by SHAPE reactivity; black, orange, and red represent low, moderate, and high reactivities, respectively. Lines indicating base pairs are colored by base pair probability (legend). Nucleotides with no SHAPE data are colored grey.
