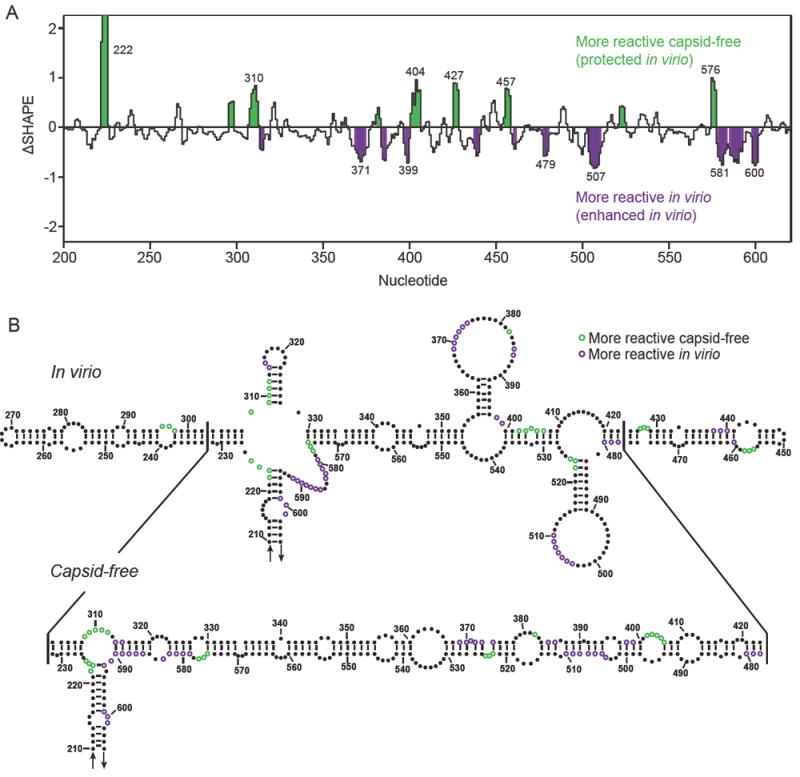
Figure 5.

Major conformational differences in the right arm of the T domain that distinguish the in virio and capsid-free RNA states. (A) ΔSHAPE values23 for the central T domain spanning positions 200 to 600 in the genome. Statistically significant changes in SHAPE reactivity between the two RNAs are highlighted in green and purple. (B) Secondary structure models for the central T domain (residues 210-605). Individual nucleotides with significantly different reactivities between the two RNA states are colored green and purple.
