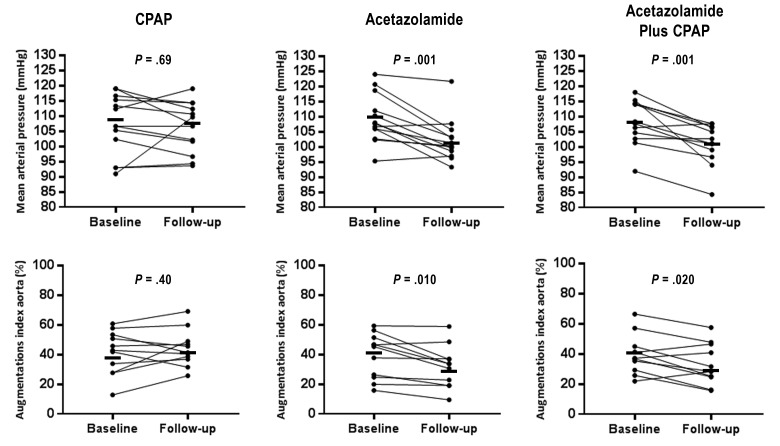
Figure 2. Hemodynamic changes following CPAP, acetazolamide, and acetazolamide plus CPAP treatments.
Individual data of office mean arterial pressure (top panels) and aortic augmentation index (bottom panels) at baseline and follow-up in the CPAP, acetazolamide, and acetazolamide plus CPAP groups. Mean values at baseline and follow-up are indicated by the solid black bars. Significance values refer to comparison within groups. CPAP = continuous positive airway pressure.

