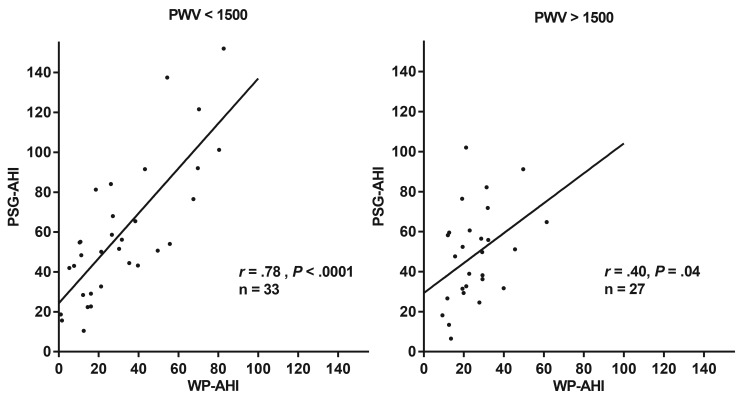
Figure 4. Scatterplots of PSG-AHI by WP-AHI based on the PWV threshold of 1500 cm/s.
Data are shown for patients with a PWV under 1500 cm/s (A) and a PWV over 1500cm/s (B). The Pearson correlation coefficients were .78 (P < .0001) and .40 (P < .04), respectively. PSG-AHI = apnea-hypopnea index as measured by polysomnography, PWV = pulse wave velocity, WP-AHI = respiratory event index as measured by WatchPAT.

