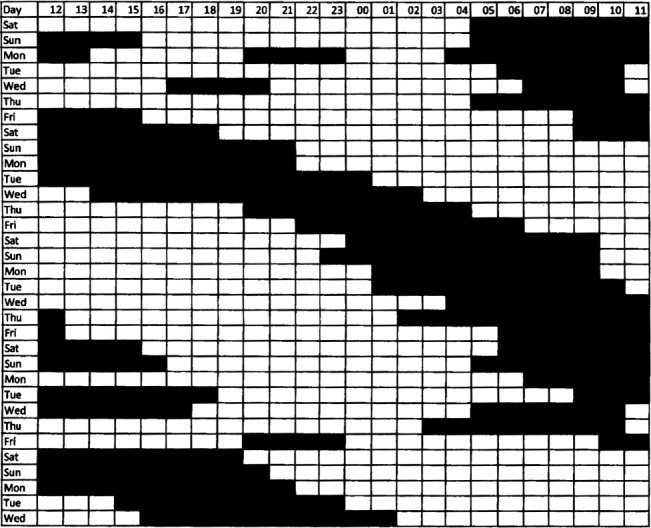
Figure 1. Sleep diary data showing progressive daily delays in sleep and wake times.

Each row represents one day. Each box represents 1 hour. The first column represents 12:00 PM – 1:00 PM and the last column represents 11:00 AM – 12:00 PM. This figure represents 4.7 out of the 20 weeks of sleep diary data that the patient provided.
