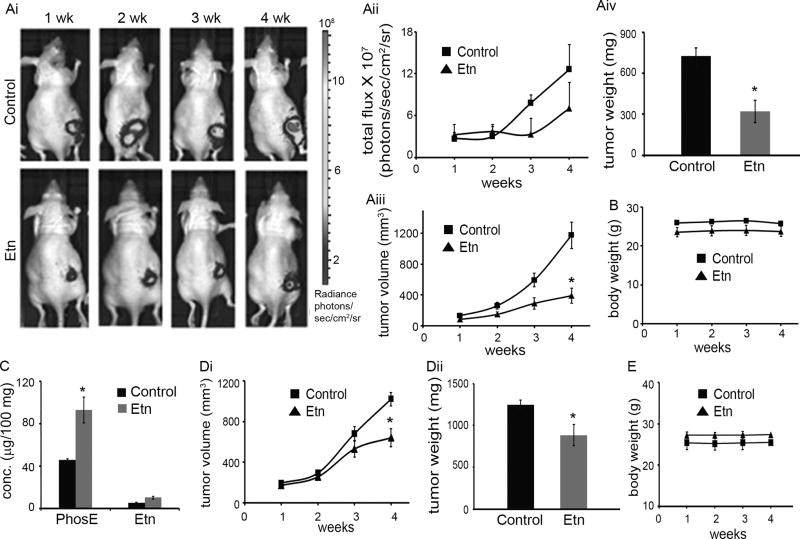
Figure 3.
Oral administration of 40 mg/kg Etn exhibited inhibition of human prostate tumor xenograft growth (PC-3-luc and DU145) in nude mice. PC-3-luc (1 million) or DU145 (2 million) cells in 100 µl PBS containing 25% Matrigel were subcutaneously injected in the right flank of 6–8 weeks old athymic male BALB/c mice to grow tumors. Mice with palpable tumors were randomly sorted in two groups of six mice each. Control group received vehicle (water) and treatment group received 40 mg/kg Etn adjusted to pH 5 with phosphoric acid by oral gavage for 4 weeks. (Ai) Representative bioluminescent images of one animal per group indicating progression of PC-3-luc tumor growth over 4 weeks in control and Etn-treated mice. (Aii) Graphical representation of the quantitative photon count from control and Etn-treated PC-3-luc tumor bearing mice for 4 weeks. (Aiii) PC-3-luc tumor growth monitored (by vernier calipers) over a period of 4 weeks. We observed ~67 % inhibition in tumor volume in comparison to control tumors upon oral administration of Etn for 4 weeks. (Aiv) Weight of PC-3-luc tumors from control and Etn-treated mice. Etn treatment resulted in ~55 % reduction in tumor weight in comparison to control tumors. (B) Body weight of vehicle and Etn fed PC-3-luc tumor bearing mice over a period of 4 weeks of treatment. (C) Intratumoral levels of PhosE and Etn in vehicle and Etn-fed PC-3-luc tumor bearing mice after 4 weeks. (Di) DU145 tumor growth monitored (by vernier calipers) over a period of 4 weeks. We observed ~42 % inhibition in tumor volume in comparison to control tumors upon oral administration of Etn for 4 weeks. (Dii) Weight of DU145 tumors from control and Etn-treated mice. Etn treatment resulted in ~29 % reduction in tumor weight in comparison to control tumors. (E) Body weight of vehicle and Etn fed DU145 tumor bearing mice over a period of 4 weeks of treatment. Values and error bars shown in the figure represent mean and SE respectively (*, p < 0.05 compared with control).

