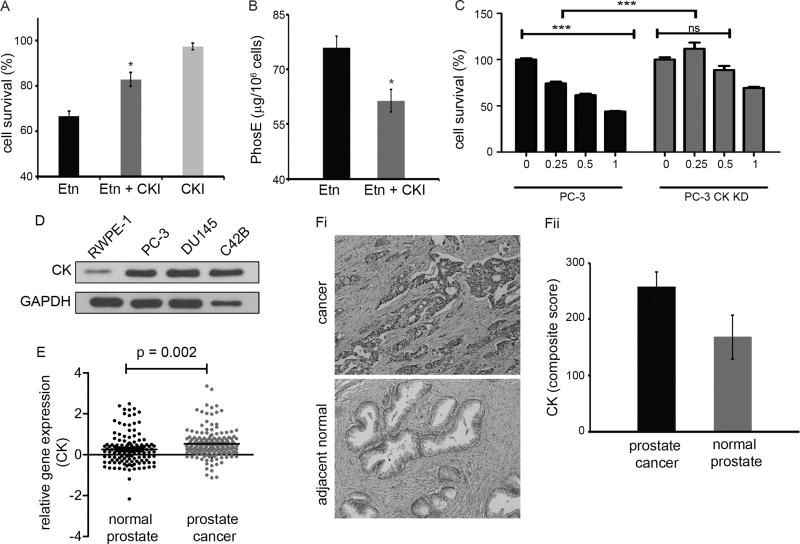
Figure 4.
Effect of choline kinase inhibition on Etn-induced inhibition of cell growth and intracellular levels of PhosE in PC-3 cells. (A) Proliferation of PC-3 cells upon Etn treatment in the presence and absence of choline kinase inhibitor (CKI). PC-3 cells were treated with 1 mg/ml Etn in the presence and absence of 1 µM CKI for 48h at pH 7.4 and cell survival was estimated by MTT assay. Choline kinase inhibition significantly abrogated Etn-induced cell death in PC-3 cells. (B) Intracellular levels of PhosE upon Etn treatment of PC-3 cells in the presence and absence of CKI. Choline kinase inhibition resulted in reduced conversion of Etn into PhosE in PC-3 cells. (C) Effect of Etn on cellular viability of PC-3 cells with CK knock down (KD) using siRNA approach. CK KD PC-3 cells were treated with 0.25, 0.5 and 1 mg/ml Etn for 48h at pH 7.4 followed by estimation of cell survival by MTT assay. (D) Choline kinase expression in prostate cancer cell lines (PC-3, DU145 and C42B) and normal prostate cell line (RWPE-1). GAPDH was used as a loading control. (E) Scatter-plot comparing choline kinase expression in normal and cancer tissue from prostate cancer patients (p = 0.002). The p value for statistical significance was set up as 0.05, while the fold change was defined as mean of all individual data points of analyzed datasets. (Fi) Micrographs showing immunohistochemical staining of choline kinase enzyme in normal and cancer tissue from prostate cancer patients. (Fii) Quantification (composite score) of choline kinase expression in normal and cancer tissue from prostate cancer patient. Five normal and five cancer tissue cases on TMA were scored for choline kinase staining percentage and intensity and composite scores were calculated using two parameters. As shown in these figures, choline kinase enzyme is highly expressed in cancer tissue as opposed to normal tissue. Values and error bars shown in the figure represent mean and SE respectively from three independent experiments (*, p < 0.05 compared with Etn; ***, p < 0.0001 compared with control).

