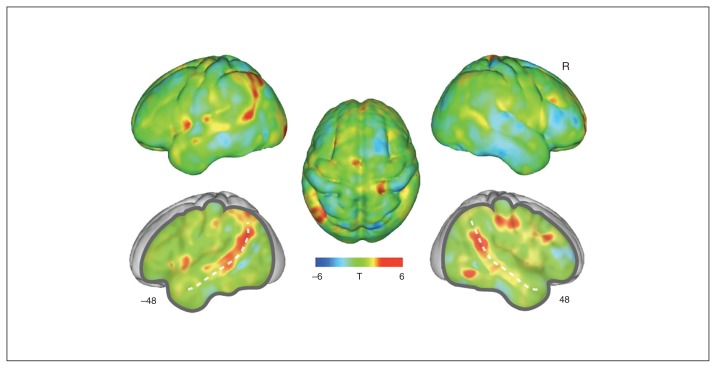
Fig. 2.
Whole brain grey matter reductions in women with anorexia nervosa compared with healthy control participants. The un-thresholded group difference T-map is overlaid on a group average brain. Positive values indicate voxels where control participants show increased grey matter compared with women with anorexia nervosa, and vice versa for negative values. Coordinates indicate X axis cuts to reveal deeper structures, shown in Montreal Neurological Institute (MNI) atlas space. The dotted line indicates the superior temporal sulcus. R = right hemisphere.

