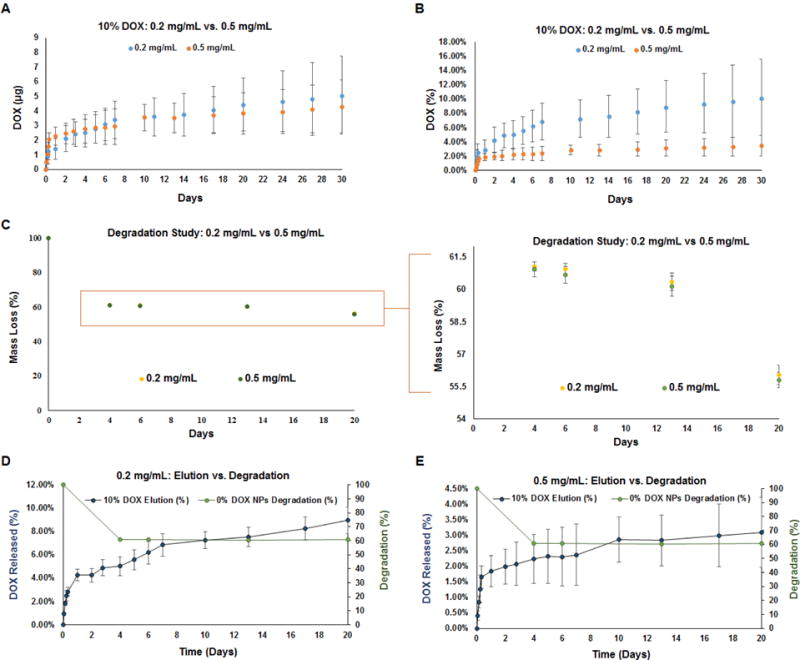
Fig. 6.

Plots showing time profile of in vitro DOX release from 10% w/w DOX-NPs at 0.2 mg/mL and 0.5 mg/mL concentrations, measured over 30 days. Plot in panel A indicates cumulative DOX amounts released (μg) and panel B indicates cumulative % of theoretically loaded DOX amounts. Panel C compares degradation profiles of 0% w/w DOX-NPs at concentrations of 0.2 and 0.5 mg of NPs/mL, measured over 20 days. Burst release of DOX from 10% w/w DOX-NPs coincided with rapid initial degradation of the polymer nanocarriers, both at 0.2 mg/of NPs/mL (Panel D) and 0.5 mg of NPs/mL (Panel E). Values shown indicate mean ± st. dev and were obtained by analysis of n=3 replicates per group
