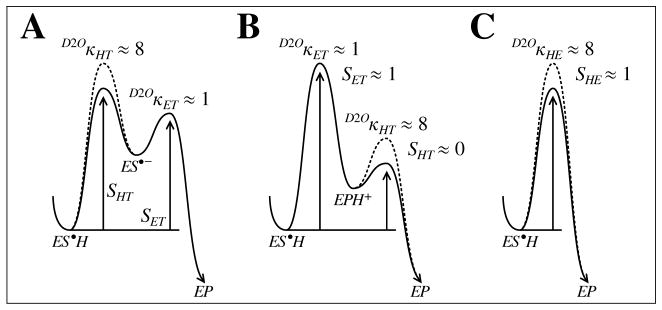
Figure 5.
Energy diagrams of the ES•H subseqence for each model of the DesII reaction. The solid curve denotes the reaction in H2O and the broken curve in D2O. The energy levels of the ES•H intermediate in H2O and D2O are aligned to make it easier to see the origin of the D2Oκ isotope effects. The deprotonation reaction is modeled with a near unit equilibrium isotope effect and a kinetic isotope of ca. 8 based on the experimental observations discussed in the text. Both the electron transfer and proton transfer steps are shown for model B for the sake of clarity; however, the electron transfer is treated as essentially irreversible. This is reflected in the values of the sensitivity indices.

