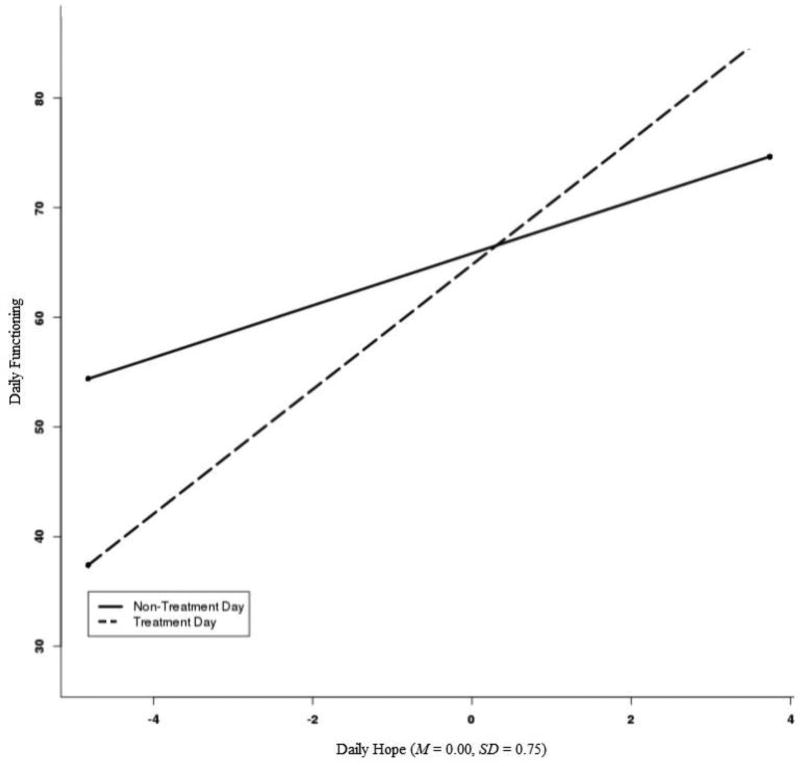
Figure 1. Interaction between Treatment Day and Daily Hope on Daily Social and Role Functioning.
Note. The x-axis for Hope represents the minimum and maximum values of hope observed in the data (−4.82, 3.74, respectively). A region of significance plot of the range of observed daily hope scores showed that the relation between treatment day and functioning was significant at values of daily hope above 1.53 (approximately 2 SDs above the mean of hope) and below −0.39 (approximately 0.5 SD below the mean of hope).

