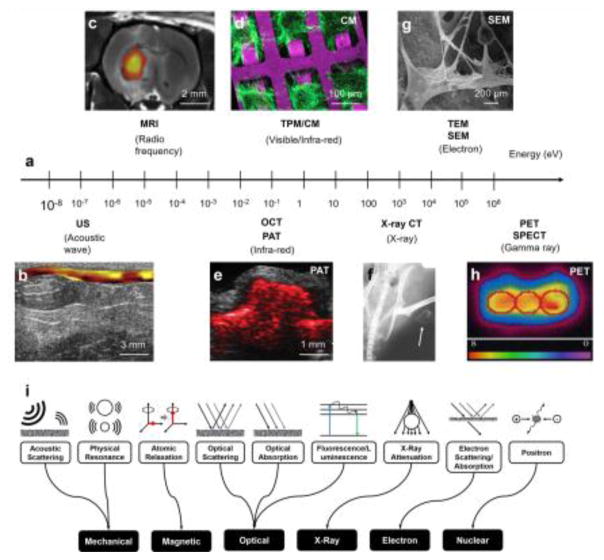
Figure 1. Biomedical imaging of biomaterials.
(a) Representative biomedical imaging modalities used in biomaterial characterization and their corresponding probing energies. US, ultrasound; MRI, magnetic resonance imaging; PAT, photoacoustic tomography; OCT, optical coherence tomography; CM, confocal microscopy; MPM, multi-photon microscopy; TEM, transmission electron microscopy; SEM, scanning electron microscopy; x-ray CT, x-ray computed tomography; PET, positron-emission tomography; SPECT, single-photon position emission tomography. (b) US elasticity imaging of a polyurethane-based tissue construct in a rat abdominal repair model at week 12. The tissue stiffness is colored from yellow (soft) to red (hard). Adapted with permission from [8]. (c) MRI image of transplanted 18F-labeled human neural stem cells (shown in color) and ECM scaffold remodeling in the stroke-damaged rat brain. Adapted with permission from [15]. (d) Confocal microscopy image of cardiomyocytes grown on a poly(glycerol sebacate) (PGS) scaffold. Adapted with permission from [20]. (e) PAT image of SWCNT-PLGA scaffold acquired at 680 nm embedded in a chicken breast tissue at the depth of 0.5 mm. SWCNT, single-walled carbon nanotube; PLGA, poly(lactic-co-glycolic acid). Adapted with permission from [7]. (f) X-ray CT image of thigh muscle pouches of a nude mouse at week 12 after implantation of zein scaffolds with rabbit mesenchymal stem cells. The white arrows indicate ectopic bone formation. Adapted with permission from [25]. (g) SEM image of a porous scaffold prepared from a composite of PLGA and hydroxyapatite (Hap), and the deposition of minerals from preosteoblasts cultured on the scaffold for 28 days. Adapted with permission from [48]. (h) PET image of transverse sections of a bioreactor chamber containing a cardiomyocyte-encapsulated fibrin scaffold under perfusion culture showing metabolic activity of the cells an hour after 18FDG labeling. 18FDG, 18F-fluordeoxyglucose. Adapted with permission from [29]. (i) Schematics showing contrast mechanisms to enhance imaging capacity.

