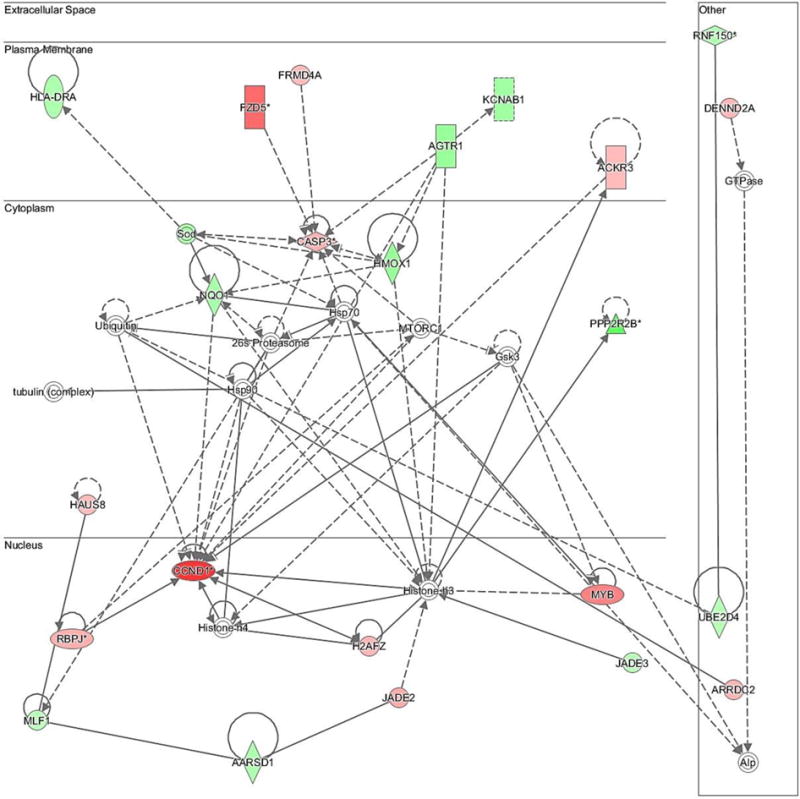
Fig. 4.

Network of differentially expressed transcripts related to cellular growth and proliferation (Network 3). The bold lines show a direct association among molecules while dashed lines show an indirect association among the molecules. Different shapes of molecules indicate different functions. Significantly up-regulated genes (P < 0.05) by FGF9 in this network were: CCND1, FZD5, MYB, CASP3, FRMD4A, ACKR3, JADE2, RBPJ, HAUS8, ARRDC2, DENND2A, H2AFZ; significantly down-regulated genes (P < 0.05) by FGF9 in this network were: HLA-DRA, AARSD1, MLF1, JADE3, UBE2D4, PPP2R2B, NQO1, HMOX1, AGTR1, RNF150, SOD, KCNAB1.
