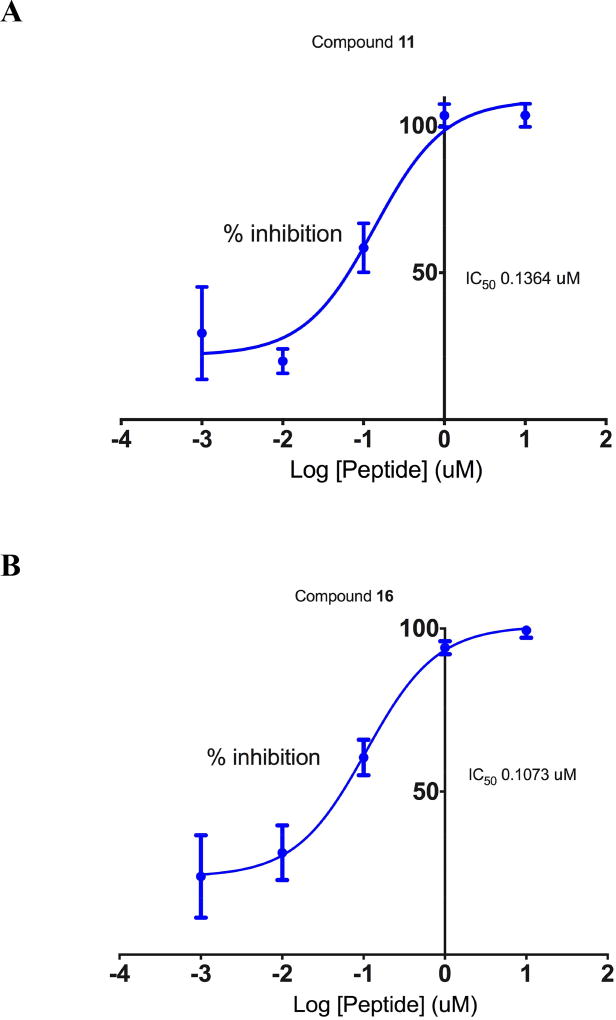
Figure 3.
IC50 determination for compounds 11 (Panel A) and 16 (Panel B). Each data point is the average of 3 determinations obtained during a single experiment + S.E.M. SEM values and 95% confidence intervals for these IC50 values are reported in Table S4 in the supporting information.

