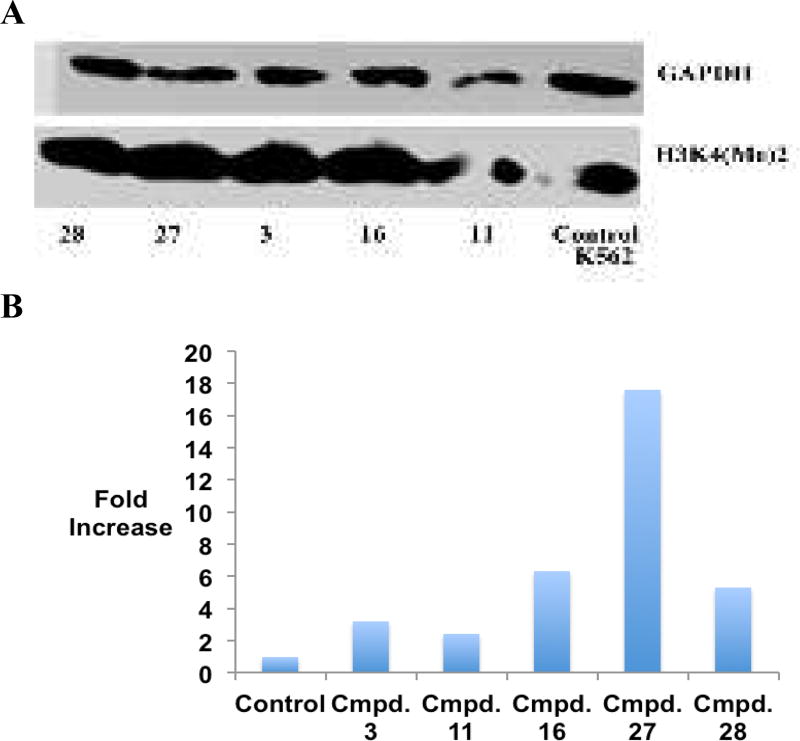
Figure 5.
Panel A. H3K4me2 expression levels in K562 leukemia cells following 48-hour exposure to 10 µM concentrations of 3, 11, 16, 27 and 28, as measured by western blot analysis. Panel B. Graphical representation of H3K4me2 expression levels in K562 leukemia cells following 48-hour exposure to 10 µM concentrations of 3, 11, 16, 27 and 28. (See supporting material for raw data extracted from western blots).

