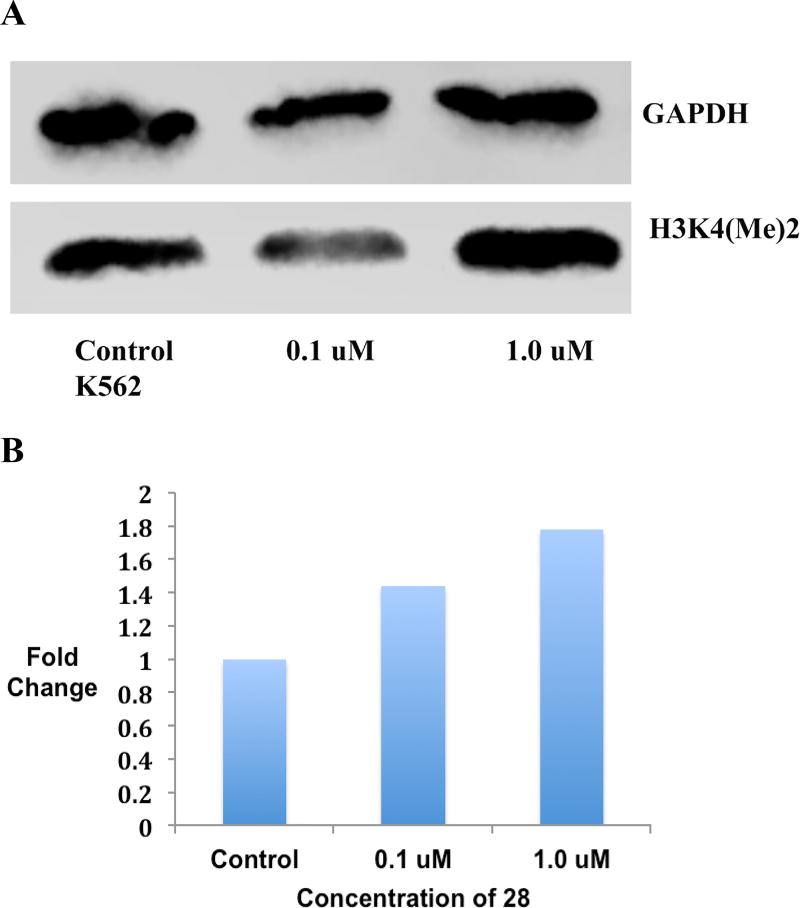
Figure 7.
Panel A. Global H3K4me2 expression levels in Calu6 lung adenocarcinoma cells following a 48-hour exposure to 0.1 and 1.0 µM concentrations of 28, as measured by Western blotting. Panel B. Graphical representation of H3K4me2 expression levels in Calu6 lung adenocarcinoma cells following a 48-hour exposure to 0.1 and 1.0 µM concentrations of 28. (See supporting material for raw data extracted from Western blots).

