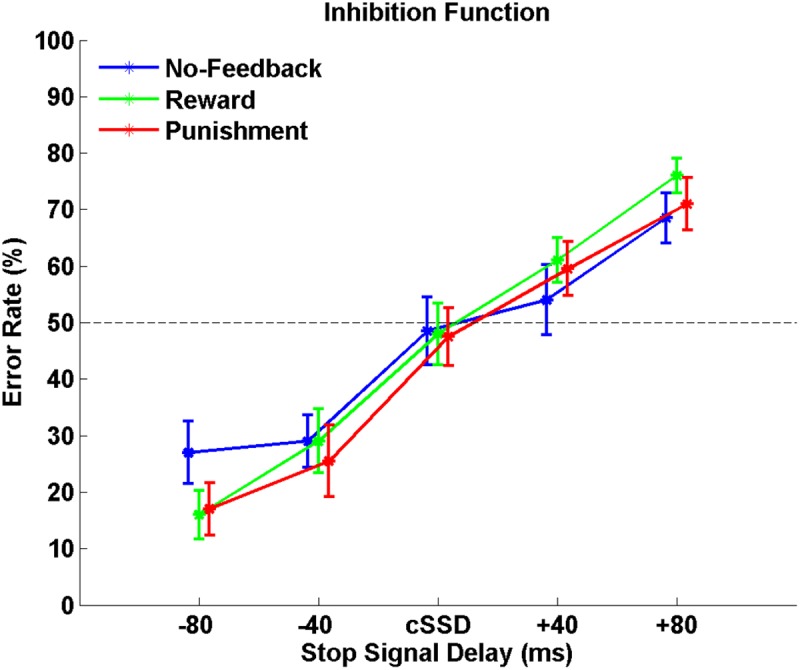
FIGURE 3.

The response inhibition functions for no-feedback (blue), reward (green), and punishment (red) conditions. Error rates are plotted against five different SSDs centered around the cSSD that was adaptively determined for each individual participant and each condition, respectively. Error bars indicate standard error of the mean.
