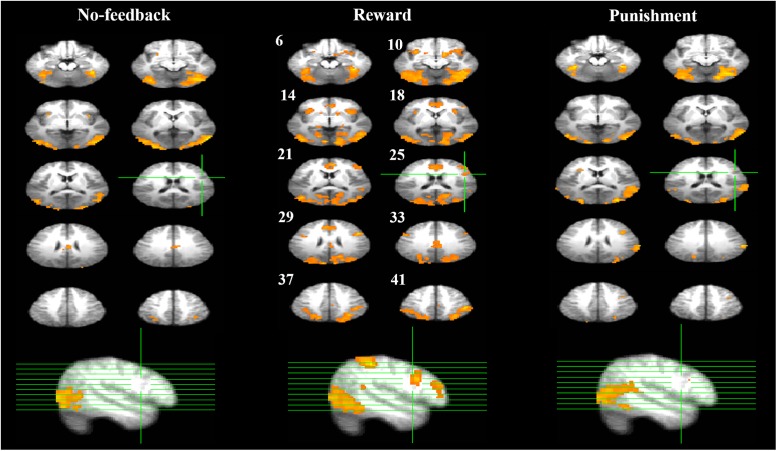
FIGURE 5.
Response inhibition associated brain regions. Brain activations associated with the no-feedback (left panel), reward (middle panel), and punishment (right panel) are rendered on the axial slices ranging between 6 and 41 mm along the z-axis (spacing 4 mm between slices). The upper-left number next to each central slice indicates the z-axis, and the same set of slices are illustrated for all conditions. The right hemisphere is on the right side of the figure. The cluster threshold alpha was set at 0.01, and the voxel-wise threshold was fixed at p < 0.001.

