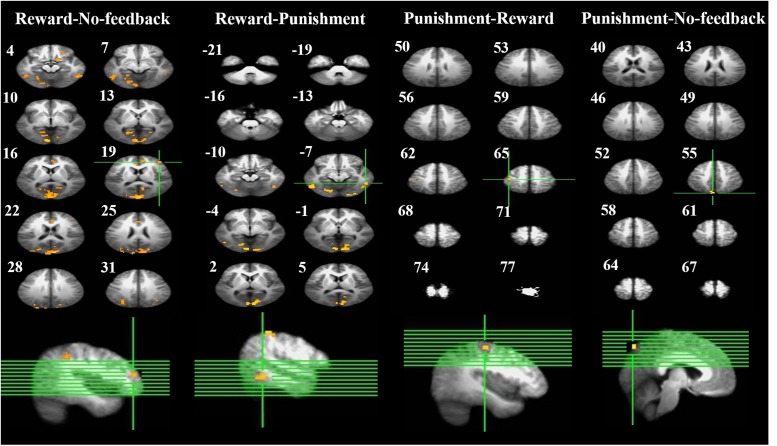
FIGURE 6.
Brain activation related to response inhibition. Left-panel: horizontal sections under reward–no-feedback; middle-panels: horizontal slices under reward–punishment and punishment–reward; right-panel: horizontal slices during the punishment–no-feedback condition. The upper left-hand number in addition to each segment indicates the z-axis. The voxel-wise threshold statistics were set at p < 0.001, and cluster threshold alpha <0.01. The right-hemisphere is on the right side of the picture.

