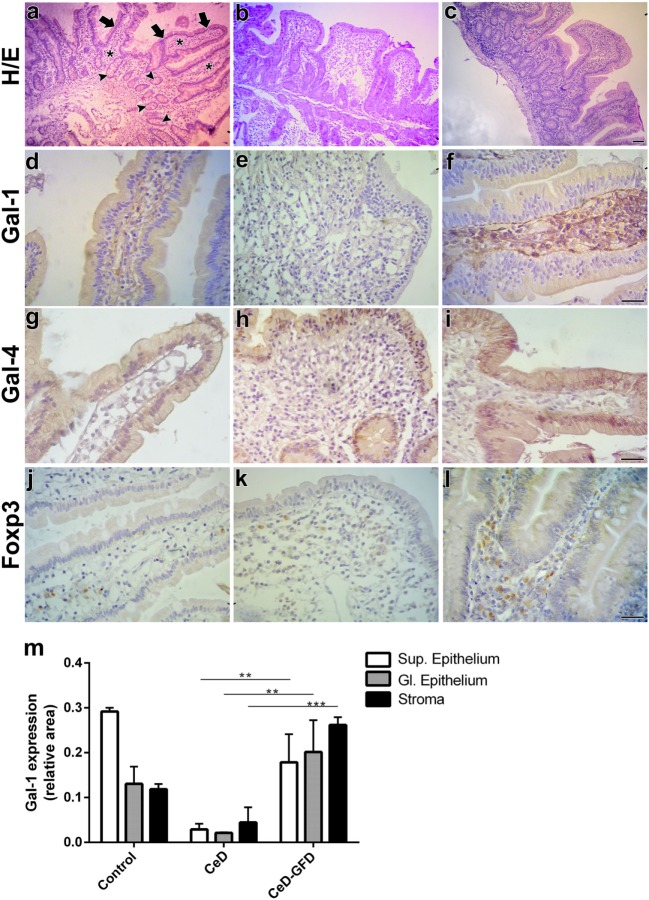
Figure 2.
Expression of galectin-1 (Gal-1), Gal-4, and Foxp3 in response to gluten-free diet (GFD) in duodenal biopsies from celiac disease (CeD) patients. Representative micrographs of control subjects, untreated CeD patients and CeD patients subjected to gluten withdrawal (CeD-GFD patients) are shown. (A–C) Hematoxylin/eosin (H/E) staining of paraffin-embedded sections of duodenal biopsies from (A) control subjects, (B) CeD patients, and (C) CeD-GFD patients. Arrows indicate the superficial epithelium, and arrowheads indicate the glandular epithelium while asterisks denote the stroma. Bar = 20 µm. (D–F) Immunohistochemical analysis of Gal-1 expression in duodenal biopsies from control subjects (D), CeD patients (E), and CeD-GFD patients (F). Bar = 20 µm. (G–I) Immunohistochemical analysis of Gal-4 expression in duodenal biopsies from control subjects (G), CeD patients (H), and CeD-GFD patients (I). Bar = 20 µm. (J–L) Immunohistochemical analysis of Foxp3+ cells in biopsies from control subjects (J), CeD patients (K), and CeD-GFD patients (L). Bar = 20 µm. (M) Quantification of Gal-1 expression determined by immunohistochemistry. Bars represent immunostained area corresponding to superficial (Sup) and glandular (Gl) epithelium, and stroma, in paraffin sections from duodenal biopsies from controls, untreated CeD patients and CeD-GFD patients. Evaluation of staining intensity was performed with the Image J software (NIH, Bethesda, MD, USA). One-way ANOVA Tukey test was used for multiple comparisons. **p < 0.01, ***p < 0.001.

