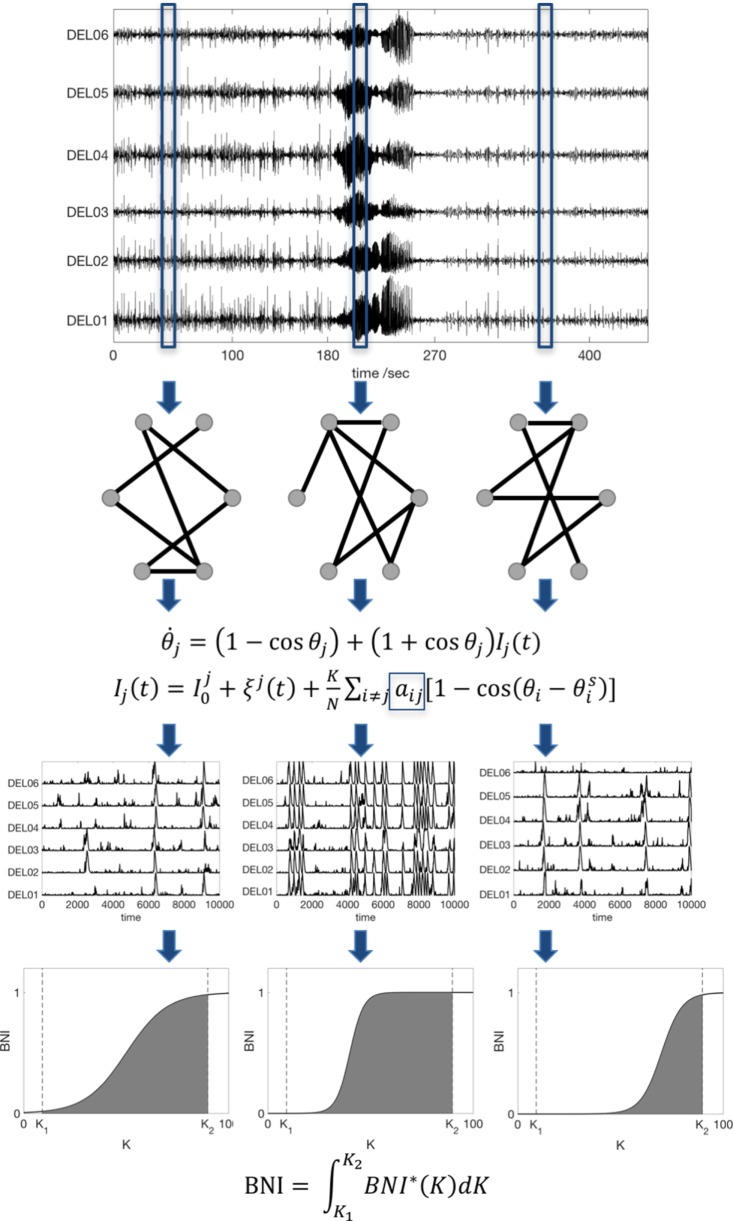
Figure 1.
Scheme of the data analysis procedure. An iEEG peri-ictal recording is divided into N segments, and each one is used to infer a functional connectivity network based on a surrogate-corrected cross-correlation measure. We then compute the dynamics in each network using the theta model, and we find the BNI as function of the coupling K. Finally, to avoid an arbitrary choice of K, the BNI is redefined as the integral of BNI in the interval [K1, K2]. For comparison between networks, the interval [K1, K2] is fixed, and sufficiently large to account for the variation of BNI as function of K. Note that the actual recordings comprise tens of channels; hence, the actual networks are much larger than the ones represented here.

