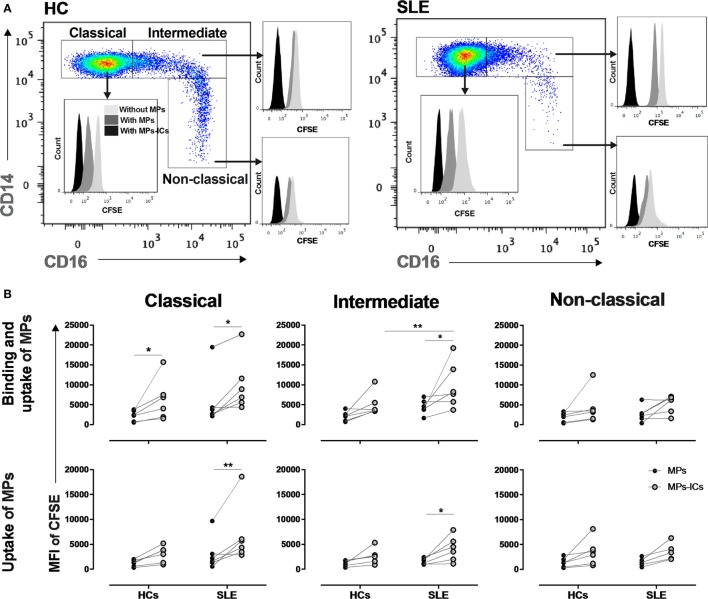
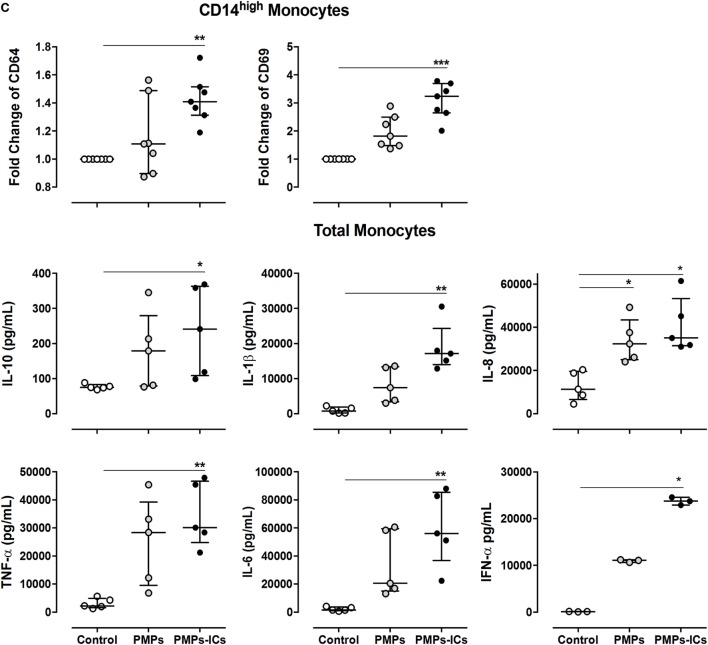
Figure 6.
Monocyte subsets showing the binding and uptake of MPs-IgG +, and PMPs-IgG + inducing monocyte activation. (A) Representative image showing the binding and uptake of microparticles (MPs) and MPs-ICs (3:1 vesicle:cell ratio) by monocyte subsets in healthy individuals (left panel) and patients with systemic lupus erythematosus (SLE) (right panel). (B) Binding and uptake (upper panel) and uptake (lower panel) of MPs and MPs-ICs (3:1 vesicle:cell ratio) by classical, intermediate, and non-classical monocytes from HCs and SLE patients. Comparisons between the groups were performed using the Wilcoxon signed-rank test; *p ≤ 0.05, **p ≤ 0.01, and ***p ≤ 0.001. (C) CD64 and CD69 expression in CD14High monocytes (upper panel) and cytokine levels in supernatants of monocytes stimulated with PMPs and PMPs-ICs (lower panel). Comparisons among the groups were performed using the Kruskal–Wallis test and Dunn’s post hoc test; *p ≤ 0.05, **p ≤ 0.01, and ***p ≤ 0.001.


