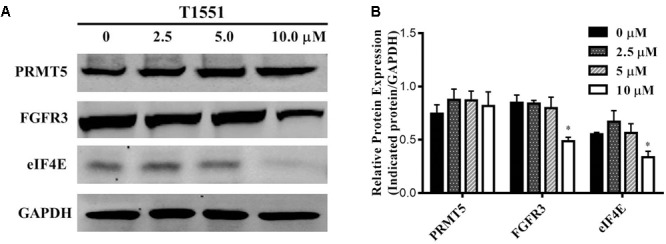
FIGURE 4.

(A) Protein expression levels of oncogene FGFR3 and eIF4E in A549 cell treated with T1551 at different concentrations (0, 2.5, 5.0, and 10.0 μM). (B) Densitometric analysis of band intensities of PRMT5, FGFR3, and eIF4E proteins. Western blot analysis was performed for 24 h, with at least three independent experiments. Data was presented as mean ± SEM (n = 3), with ∗p < 0.05 for comparison between control group (DMSO-treated group) and T1551-treated group.
