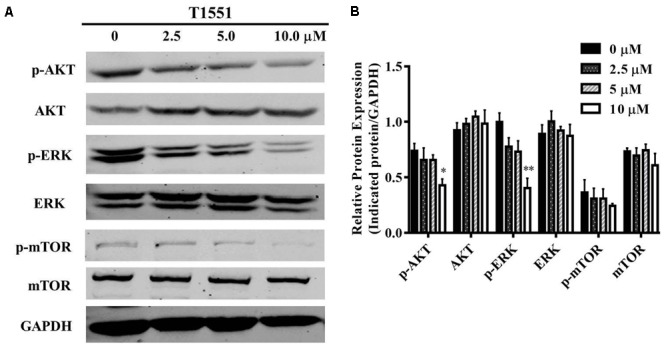
FIGURE 5.

(A) Protein expression levels of p/T-AKT, p/T-ERK, and p/T-mTOR in A549 cell treated with T1551 at different concentrations (0, 2.5, 5.0, and 10.0 μM). (B) Densitometric analysis of band intensities of p/T-AKT, p/T-ERK, and p/T-mTOR. Western blot analysis was performed for 24 h, with at least three independent experiments. Data was presented as mean ± SEM (n = 3), with ∗p < 0.05 and ∗∗p < 0.01 for comparison between control group (DMSO-treated group) and T1551-treated group.
