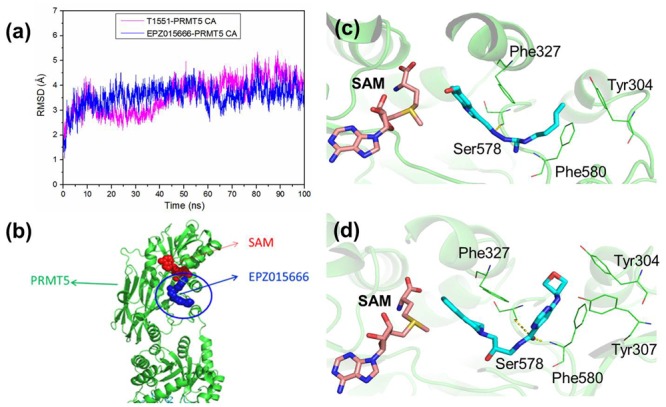
FIGURE 6.

(a) Time series of RMSDs of protein CA atoms during the 100 ns simulation in PRMT5-SAM-T1551 and PRMT5-SAM-EPZ015666 systems. (b) Crystal structure of PRMT5-SAM-EPZ015666 (PDBID: 4X61). The binding modes of PRMT5 with (c) T1551 and (d) EPZ015666. Both two complex structures were extracted from the last equilibrated 20 ns trajectory by clustering analysis.
