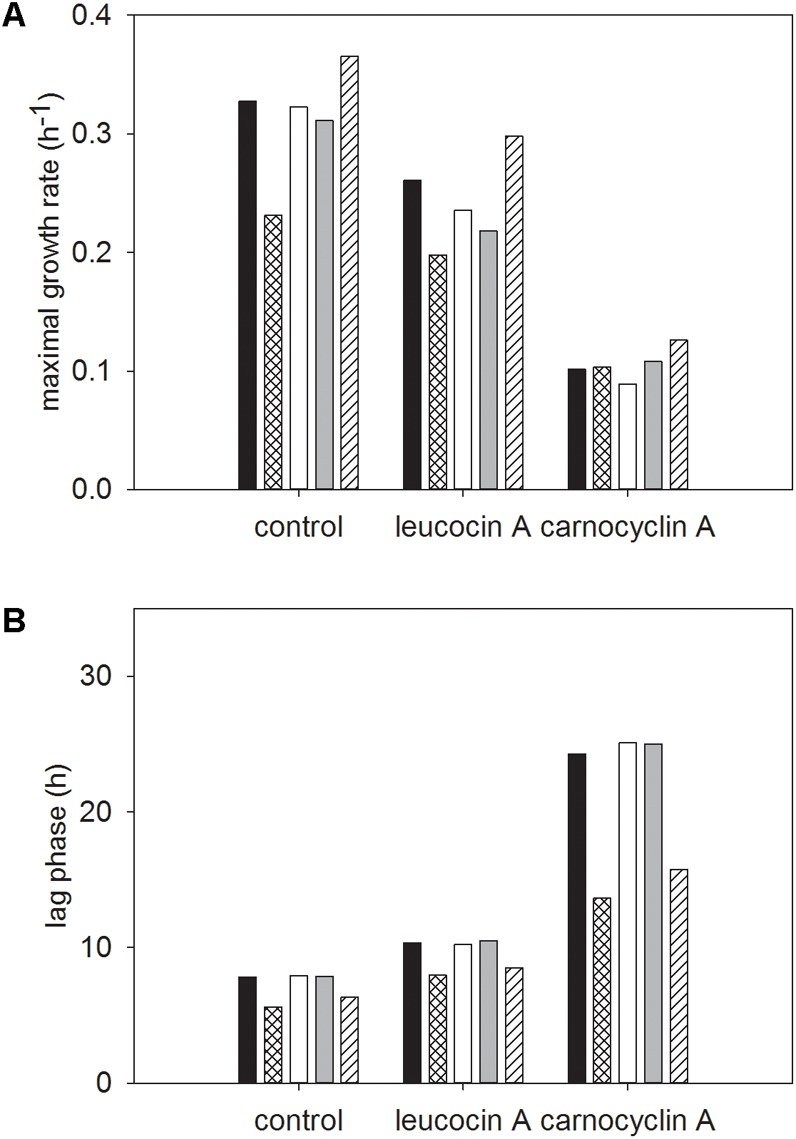
FIGURE 6.

Least squared means of significant two-way interactions for the maximal growth rate (A) and lag phase (B) of each carbohydrate glucose (■), sucrose ( ), fructose (□), mannose (
 ), cellobiose (
 ) by control or bacteriocin treatment (leucocin A, carnocyclin A), regardless of strain of L. monocytogenes (n = 3).
