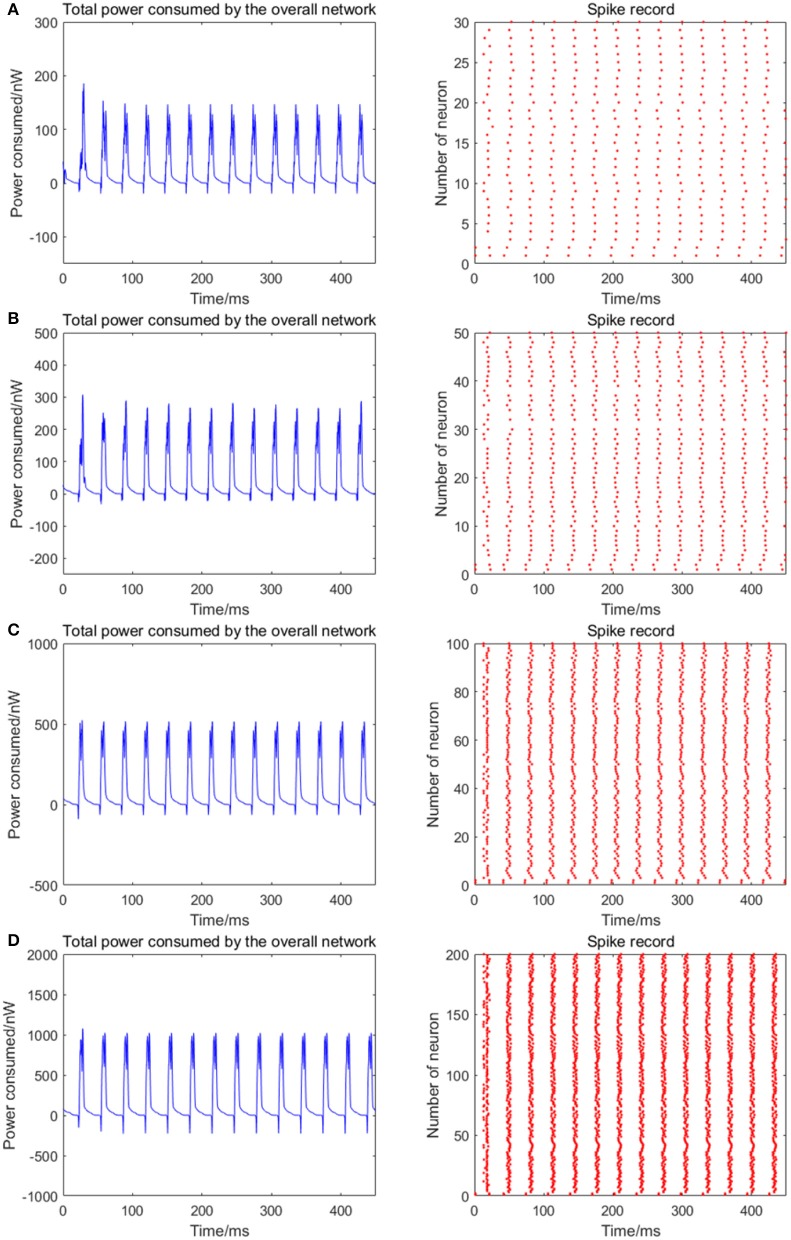
Figure 5.
The total power consumption and the spike record of the overall network under continuous stimulus. The number of neurons in (A–D) are 30, 50, 100, 200, respectively. The coupling strength is uniformly distributed in [0, 0.5]; the signal transmitting delay is uniformly distributed in [0.3 ms, 1.8 ms]. The periodicity of the total power consumption curve is increasingly apparent and the spike record exhibits clear streaks with the increasing size of the network which indicates the synchronization of neuronal activity is getting stronger.

