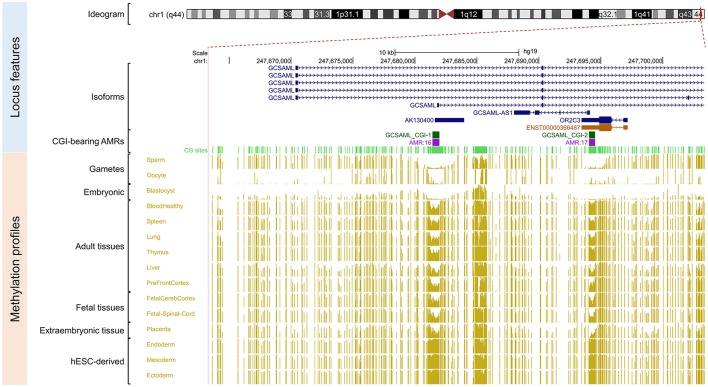
Figure 4.
Secondary intermediate methylation status at the GCSAML predicted secondary promoter. Chromosome 1 ideogram; physical positions and domain features of the GCSAML locus displaying the methylation status at the CpG sites (golden ticks) across a 40 kb long-span view (hg19; chr1:247663350-247703349). The methylation levels are represented on a scale from 0 to 1 (hypomethylated to hypermethylated). The image is centered on the intronic CGI (GCSAML CGI-1 track) near the GCSAML predicted secondary promoter-flanking region. The light green ticks represent the positions of the CpG sites. The GCSAML locus overlaps two other annotated genes (GCSAML-AS1 and OR2C3). The annotated features (from top to bottom) are as in Figure 2. The methylation level across the CpG sites within the GCSAML candidate iDMR ranges from 0.35 to 0.65 in adult somatic tissues. In methylomes from male and female gametes and from blastocysts, this region is hypomethylated.

