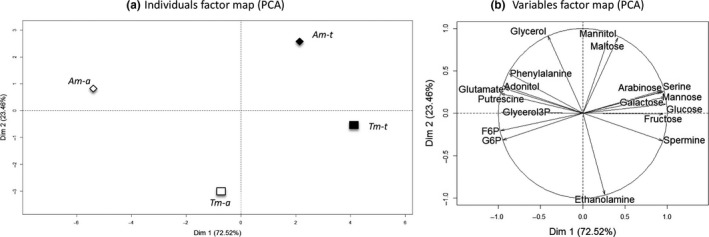
Figure 6.

Principal component analysis (PCA) of root metabolite profiles for the aquatic and terrestrial morphotypes conducted in aquatic (Am‐a, Tm‐a) or in terrestrial (Am‐t, Tm‐t) conditions. (a) Individuals factor map. Each data point represented the mean of the metabolite in the three biological repetitions. (b) Variables factor map
