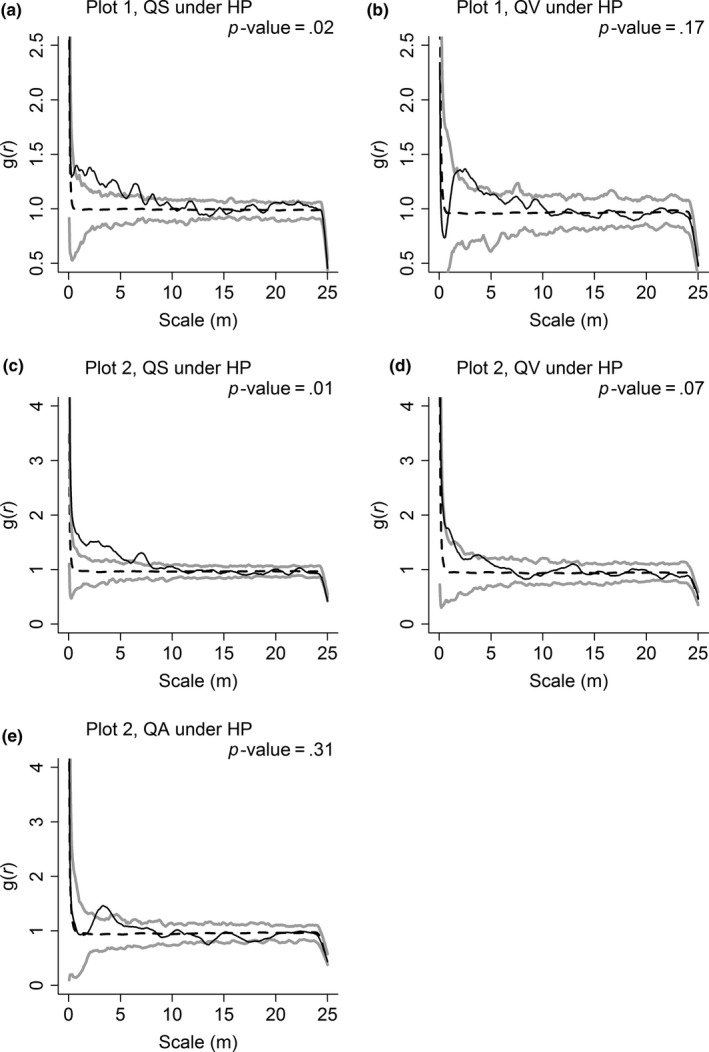
Figure 4.

Spatial patterns of Quercus serrata var. brevipetiolata (QS), Q. variabilis (QV), and Q. aliena var. acutiserrata (QA) in Plot 1 (a and b) and Plot 2 (c, d, and e). The spatial patterns of Quercus species are contrasted with heterogeneous Poisson's process null model (HP) using the g(r) function. Approximately 99% simulation envelopes (gray solid lines) are obtained from 199 Monte Carlo simulations of HP. The black solid line indicates the observed value, and the black dashed line indicates the theoretical value
