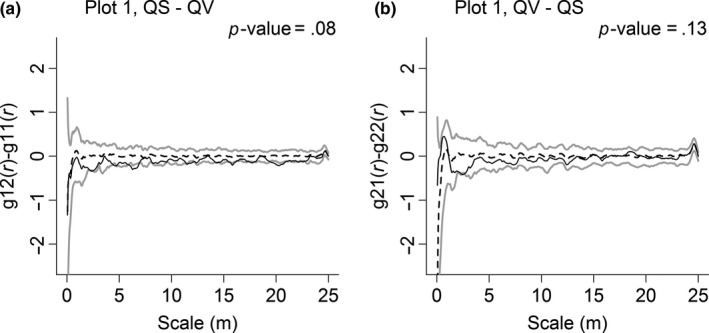
Figure 5.

Similarity in spatial distributions of Quercus serrata var. brevipetiolata (QS) and Q. variabilis (QV) in Plot 1. To generate 99% confidence envelopes (gray solid lines), 199 Monte Carlo simulations are used. The black solid line indicates the observed value, and the black dashed line indicates the theoretical value
