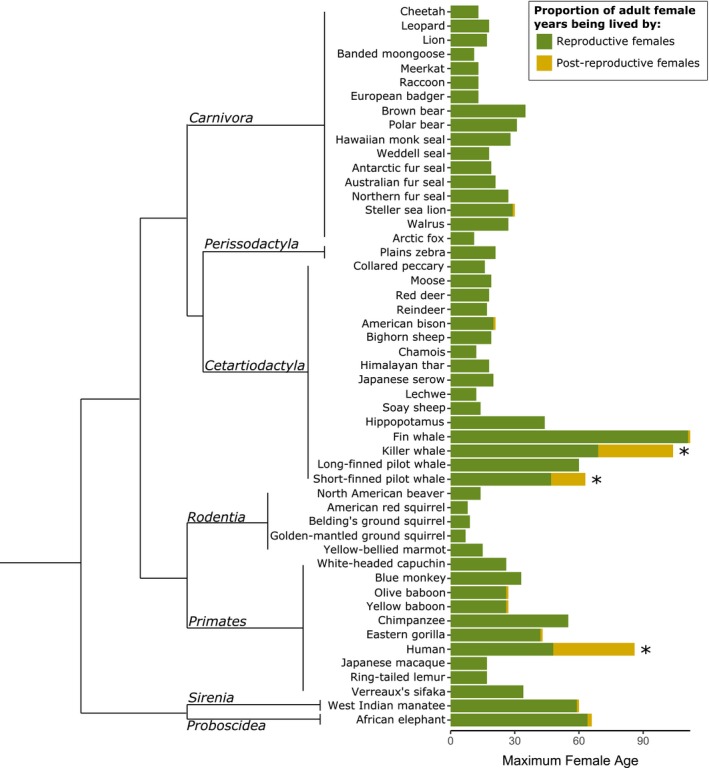
Figure 1.

Proportion of female years in the population being lived by postreproductive individuals, scaled by maximum female age in 52 species of mammal. Each bar (right) shows the proportion of female years in the population being lived by reproductive (green) and post reproductive (orange) females. The length of the bar is equivalent to the maximum female lifespan of the species. A significant proportion of adult females years being lived by postreproductives is indicated by an asterisk (*). Species are ordered by family according to (Meredith et al., 2011) and within family alphabetically. Phylogeny (left) represents the relationships between mammalian orders (Meredith et al., 2011), branches are unscaled.
