
Figure 2.
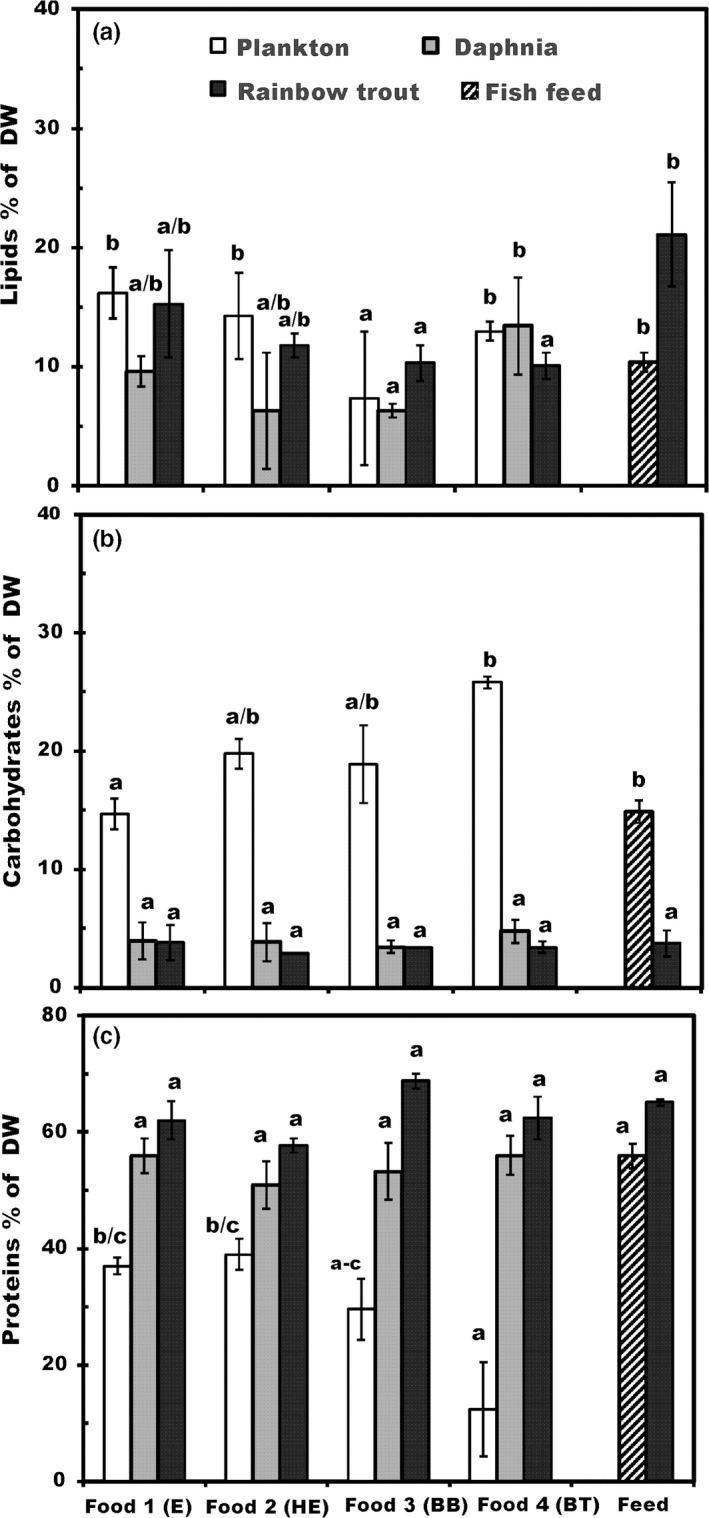
The (A) lipid, (B) carbohydrate, and (C) protein content (% of dry weight, mean ± 1 SD) of basal foods (1–4), Daphnia fed on basal foods, fish feed, and rainbow trout juveniles. The number of analyzed samples (n) is four for all groups. Different letters (a–c) denote significant differences (p < .05) between diets