
Figure 3.
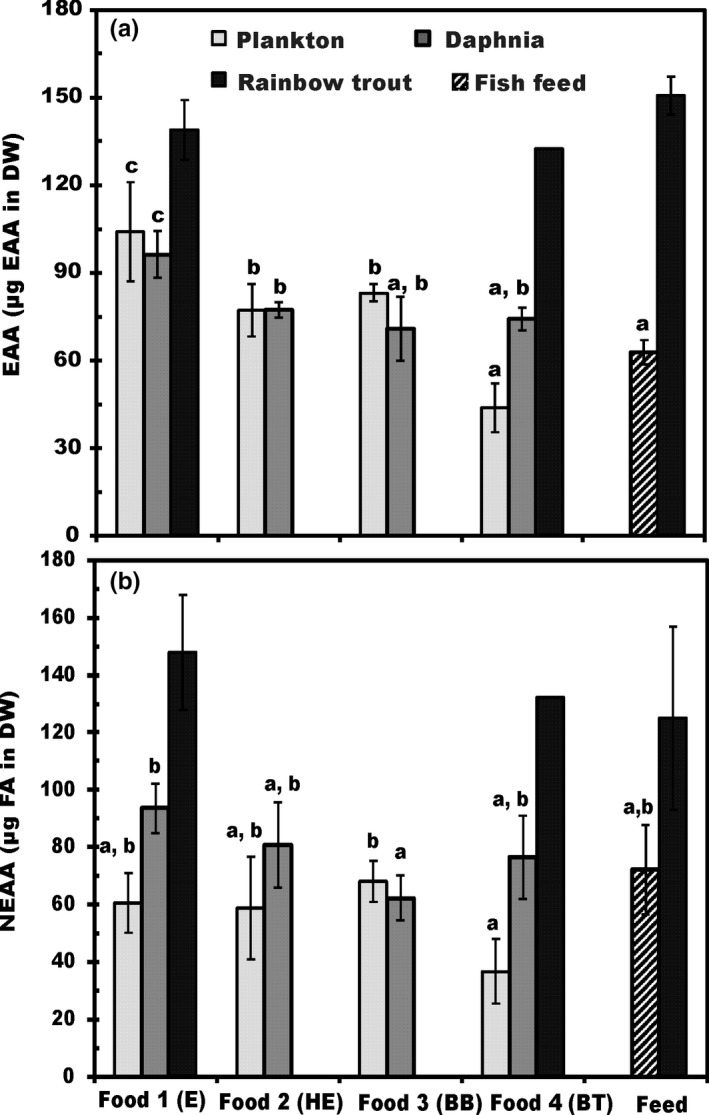
Percent abundance by mass (μg amino acids per mg DW ± 1 SD, see text for amino acid groups) of (A) essential amino acids (EAA) and (B) nonessential amino acids (NEAA) in three trophic levels (plankton, Daphnia, and juvenile trout). Number of analyzed samples (n) is four for basal foods, Daphnia, and fish fed fish feed. There were only two surviving replicates of fish under treatment HE (food 2) and only one for under treatment BT (food 4). There was insufficient sample for analysis of fish treatments HE and BB (foods 2 and 3). Different letters (a–c) denote significant differences (p < .05) between diets in amino acid content