
Figure 5.
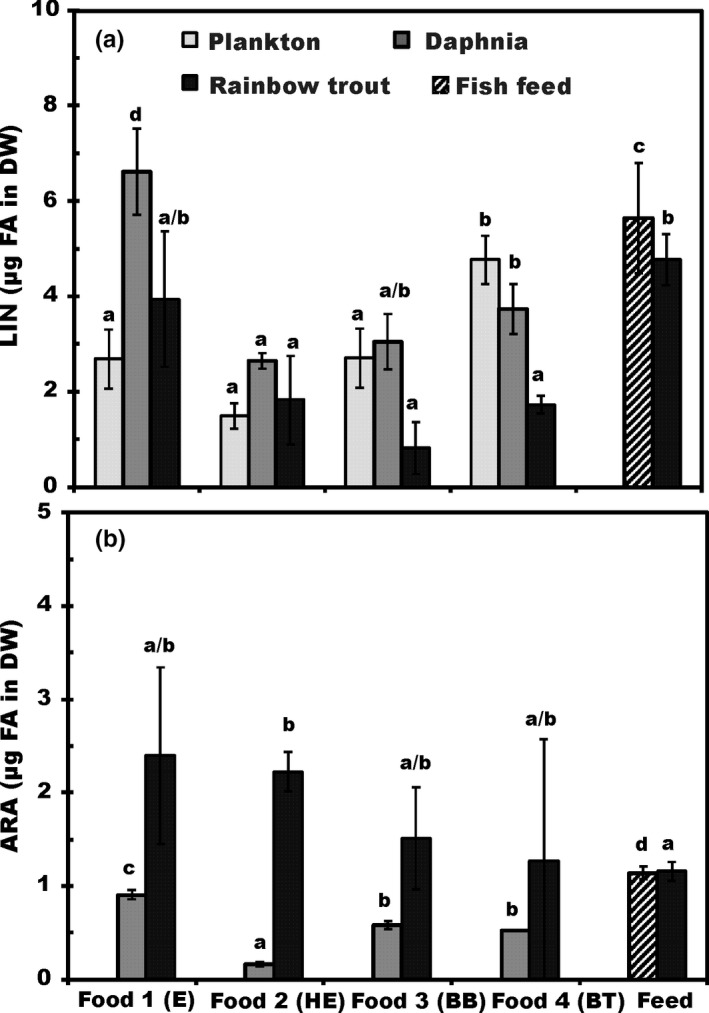
Percent abundance by mass (μg FA in mg DW ± SD) of (A) linoleic acid (LIN; 18:2ω6), and (B) arachidonic acid (ARA; 20:4ω6) across three trophic levels (plankton, Daphnia/feed, and trout juveniles). Number of analyzed sample (n) is 4 for all samples. Different letters (a–c) denote significant differences (p < .05) among diets in fatty acid content