Figure 2.

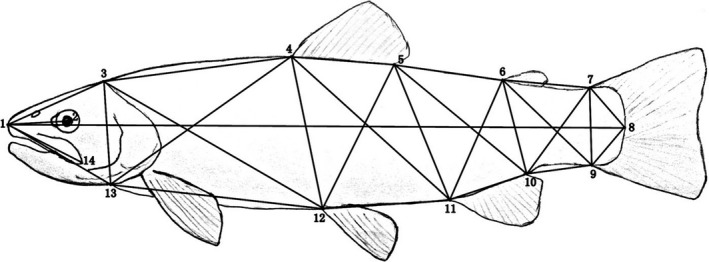
Landmarks (1–14) and the distances between the landmarks using in the morphometric analysis of brown trout and salmon used in the analysis

Landmarks (1–14) and the distances between the landmarks using in the morphometric analysis of brown trout and salmon used in the analysis