
Figure 6.
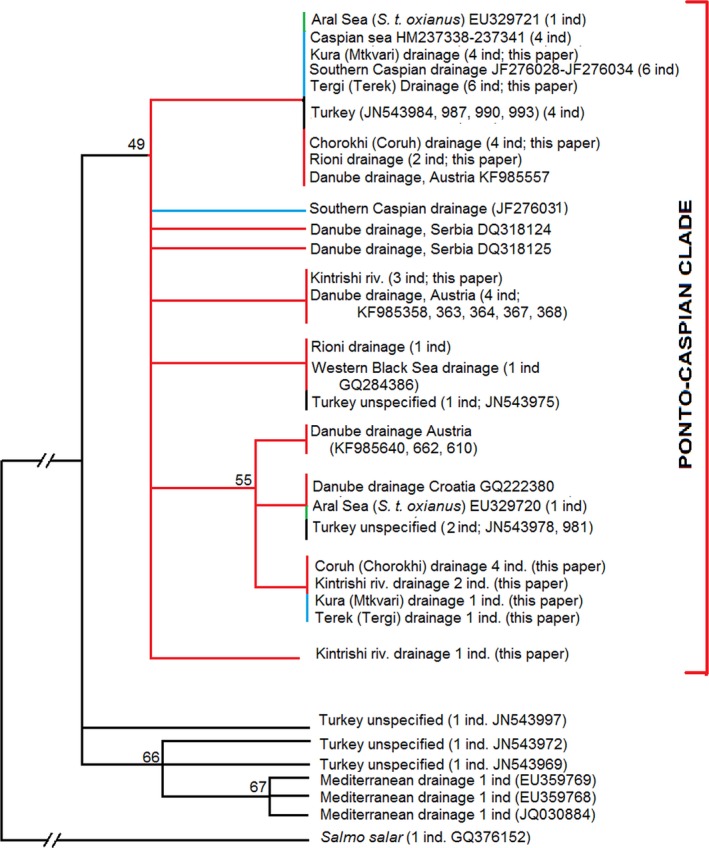
Maximum likelihood tree based on the control region sequences of Salmo. Bootstrap support shown above the nodes. Identical haplotypes shown separately if found at more than one location. Clades with bootstrap support below 49 shown as polytomies. Red branches—samples from the drainage of the Black Sea; blue branches—samples from the drainage of the Caspian Sea; green branches—samples from the drainage of the Aral Sea