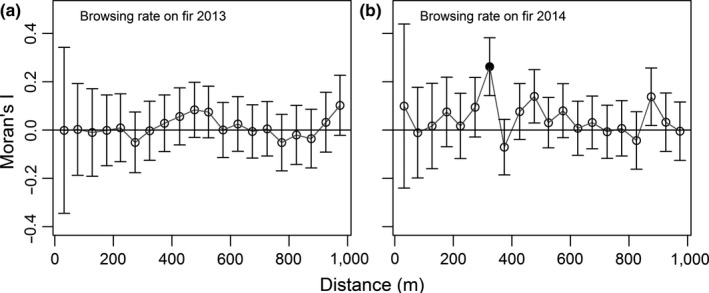
Figure 2.

Correlograms for the browsing rate on fir (Abies balsamea, number of shoots browsed/number of shoots available) in 4 m2 plots in (a) 2013 and (b) 2014 on Anticosti island (Québec, Canada). Moran's I was calculated for pairs of plots in distance classes of 50 m. The first bin included distance from 11 m to 50 m, as plots were separated by a minimum of 11 m to prevent overlap. Error bars are 95% confidence intervals. The black dot indicates a statistically significant value with a progressive Bonferonni correction of the α‐level, starting with α = 0.05
