Figure 3.

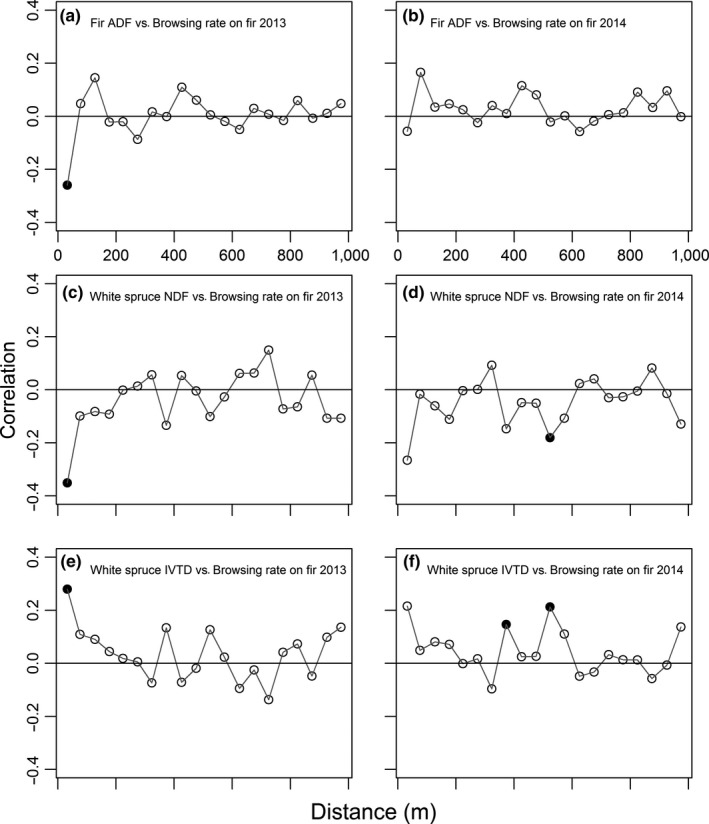
Cross‐correlograms of the correlation between the browsing rate on balsam fir (number of shoots browsed/number of shoots available) in 4 m2 plots in 2013 (left column) and 2014 (right column) and (a and b) nutritional characteristics of neighboring fir (Abies balsamea) and (c–f) white spruce (Picea glauca). Cross‐correlograms between browsing on fir (2013 and 2014) and fir ADL (lignin) content are almost identical to the relation with fir ADF (cellulose and lignin; (g–h) and are presented in Appendix S2. Data were collected on Anticosti island (Québec, Canada). Correlations between each pair of variables were calculated for pairs of plots in distance classes of 50 m, and the point is located at the mean value for the class. The first bin included distance from 11 to 50 m, as plots were separated by a minimum of 11 m to prevent overlap. Black dots indicate statistically significant values with a progressive Bonferonni correction of the α‐level, starting with α = 0.05
