
Figure 4.
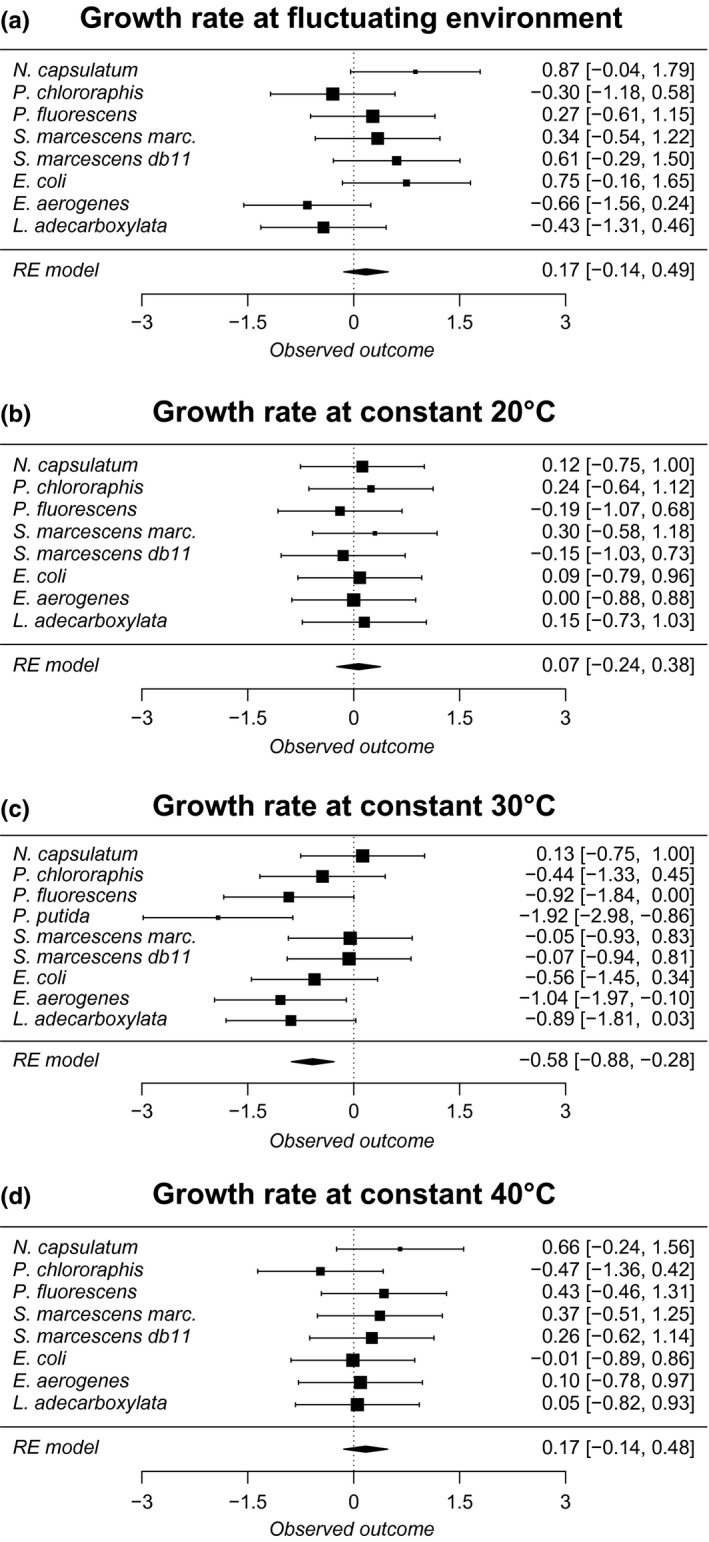
Forest plots of meta‐analyses (corresponds to Table 2) of the growth rate in different measurement temperatures (a) fluctuating (2 hr 20°C, 2 hr 30°C, 2 hr 40°C) (b) constant 20°C (c) constant 30°C (d) constant 40°C for all studied species. If effect sizes are higher than zero, it indicates a better performance of clones adapted to fluctuating temperature than clones adapted to constant (30°C) temperature. Effect sizes and their confidence intervals (±95%) are denoted in the right‐hand side of the figure. RE model indicates estimate for random effect meta‐analysis model. Different sized symbols denote weighing (larger more weight, smaller less)