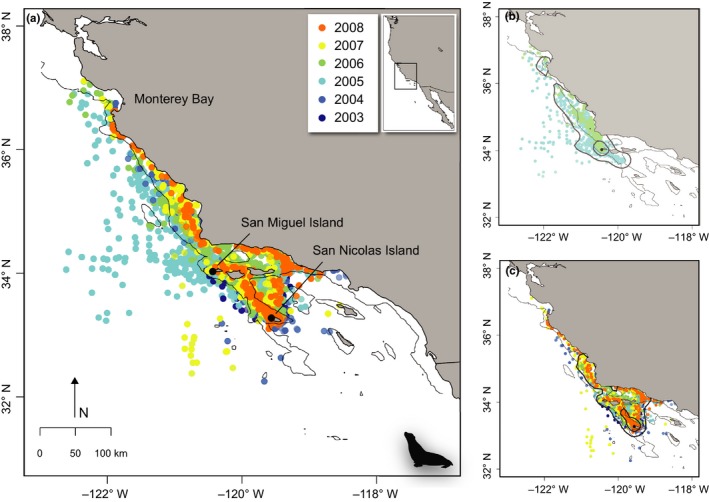
Figure 1.

(a) Daily locations from all foraging trips of lactating female California sea lion tracks (Zalophus californianus, n = 72), from November to February 2003–2009 (color‐coded by year of deployment) displaying one location per day. Distribution of tracks by colony: (b) San Miguel (n = 17) and (c) San Nicolas Islands (n = 55). Deployment locations shown as black circles. The 500‐m isobaths are shown in light gray, and the 50% and 95% kernel density utilizations for each colony are shown in dark gray
